


0
Currency & Commodity Analysis:
US Dollar Index:
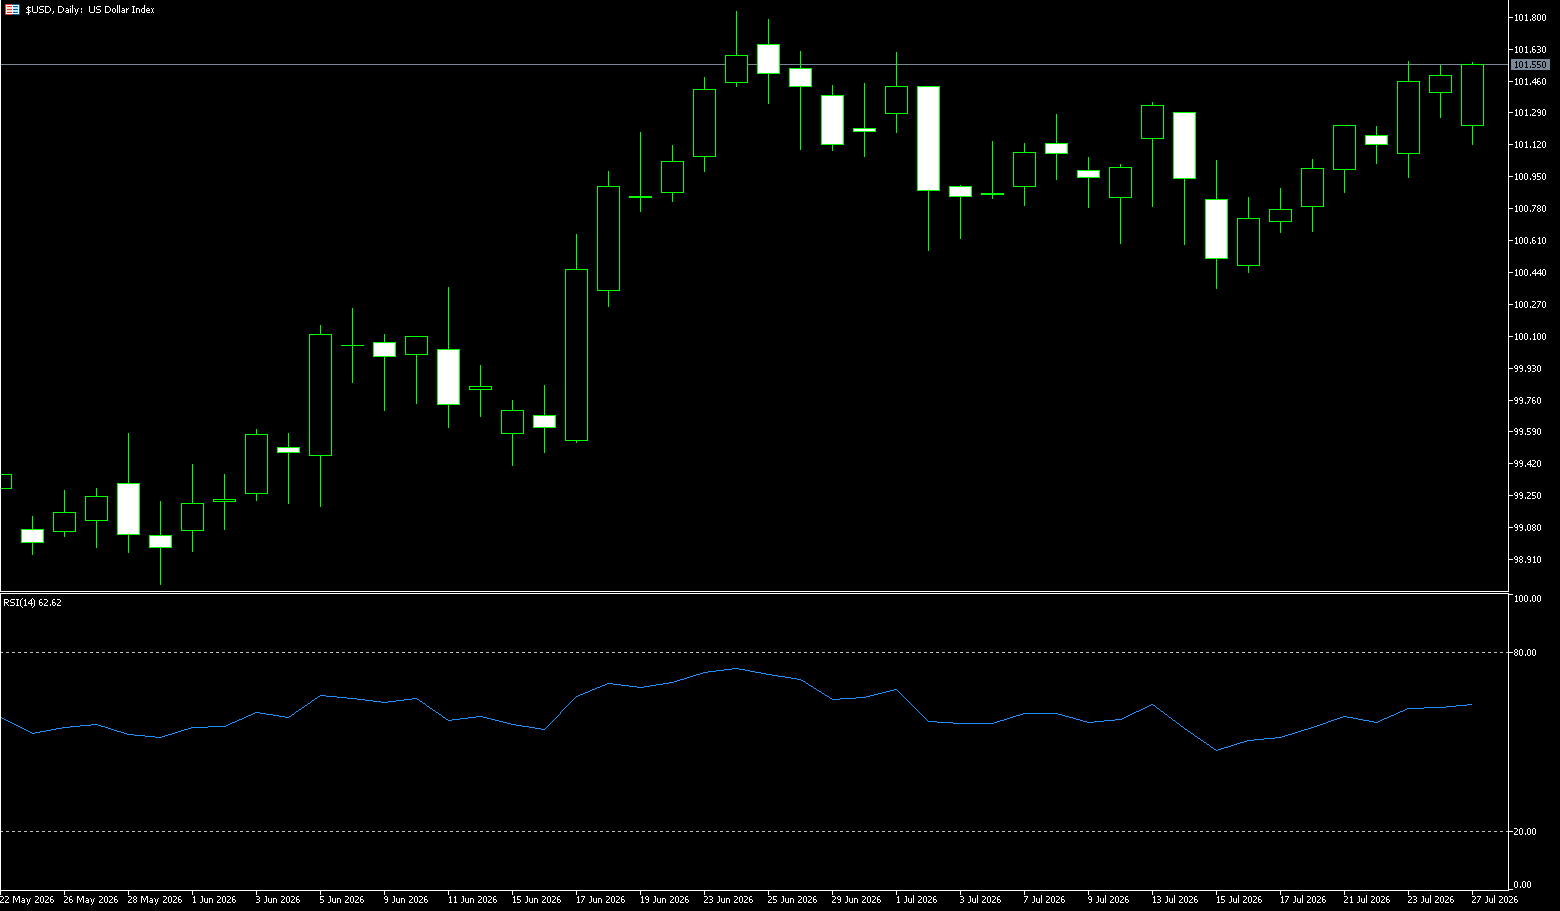
The US dollar recorded its largest weekly gain since mid-June last week, rising 0.7%. The US dollar index rose to 101.45 last week, mainly supported by rising oil prices and inflation concerns. A stronger dollar pressured non-dollar currencies, while the yen continued to struggle near 40-year lows. The dollar index closed around 101.45, with high oil prices reshaping inflation expectations, which in turn reinforced bets on interest rate hikes, providing support for the dollar. The dollar's recent support has primarily come from oil prices. A new round of attacks in the Iranian conflict pushed Brent crude to $102 a barrel, reigniting inflation concerns. Market pricing for a rate hike at this week's Fed meeting surged from 12.8% a week ago to 35.8%, although June inflation data had briefly eased market expectations, but escalating geopolitical tensions quickly reversed this optimism. The perception that the US economy is more resilient to energy price shocks than Europe and Japan further solidifies the dollar's relative advantage.
The Fed is expected to keep interest rates unchanged this week, but at least two members are expected to vote hawkishly against it, as some members are losing patience with persistently high inflation. This assessment suggests that even if rates remain unchanged, the signals from the meeting may lean hawkish, providing additional support for the dollar. The US dollar index has rebounded from its low of 95.56 at the beginning of the year to a high of 101.80 in June, currently trading around 101.40, between 101.53 (last week's high) and the psychological level of 101. The MACD indicator is near the zero line, lacking a clear directional signal in the short term, and maintaining an overall slightly bullish oscillating pattern. On the upside, watch the 101.53 (last week's high) and the 101.80 area (June high). On the downside, consider the 101.00 (psychological level) and the 100.87 (34-day moving average) level.
Today, consider shorting the US dollar index at 101.60, with a stop loss at 101.70 and targets at 101.10 and 101.20.
WTI Crude Oil
On Monday, US crude oil opened more than 6% lower at $82.85, as easing tensions in the Middle East reduced concerns about insufficient oil supply, and President Trump decided to "leave some room for maneuver" in diplomatic efforts toward Iran. Meanwhile, the Iranian military also announced a suspension of retaliatory strikes against US allies in the Middle East. In the short term, the pricing logic of the crude oil market is almost entirely driven by geopolitics. The market seizes on any sign that the situation might be resolved, and no investor is willing to establish directional exposure in a highly uncertain environment. This precisely explains the vulnerability of oil prices in the face of rumors of peace talks. Inventory levels offer a reminder. The current energy market remains fragile, with overall inventories still tight. This tightness could change rapidly due to a single piece of news, so both supply and demand deserve close attention. The core suspense in the market going forward lies in whether the actual navigation situation in the Strait of Hormuz will further deteriorate, and whether peace talks can open a genuine diplomatic channel between the US and Iran.
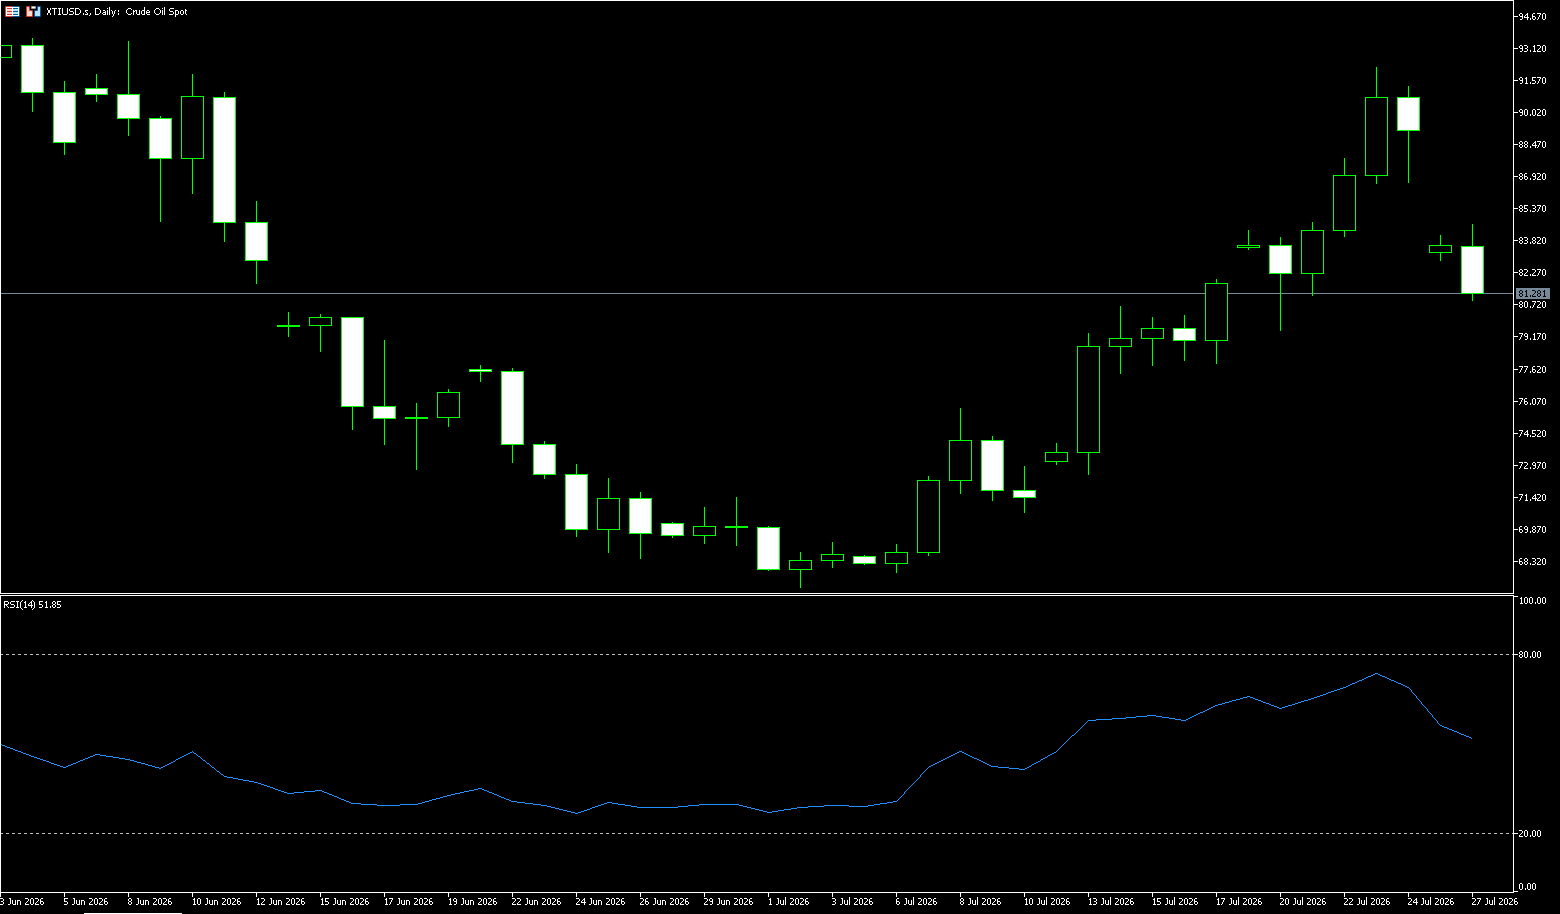
WTI crude oil recently broke through $90 per barrel, but has now fallen back to above $81 per barrel, a daily drop of over 8%, but a weekly gain of over 10%. The pullback from above $92 to around $81 per barrel appears to be profit-taking at higher levels, but in reality, it reflects the market's differentiation between actual supply losses and unconfirmed potential risks. The daily chart shows that WTI crude oil prices have risen steadily from a low of $67 in early July, reaching a high of $92.25 last week, and are currently trading at around $81.50. This indicates a significant deviation between the current price and the medium-term equilibrium level. The MACD indicator shows that upward momentum is still in a clear expansion phase. However, the price has entered a period of high-level consolidation after touching the upper Bollinger Band, suggesting that the market has transitioned from a trend initiation phase to a high-volatility phase. At this point, the same news item may cause larger intraday swings, but it may not necessarily lead to a sustained one-sided trend. Therefore, watch the $80.00 (psychological level) and $77.60 (last week's low) area on the downside; and the $88.36 (100-day simple moving average) and $92.25 (last week's high) level on the upside.
Today, consider going long on crude oil at 81.00, with a stop loss at 80.80 and targets at 83.00 and 94.00.
Spot Gold
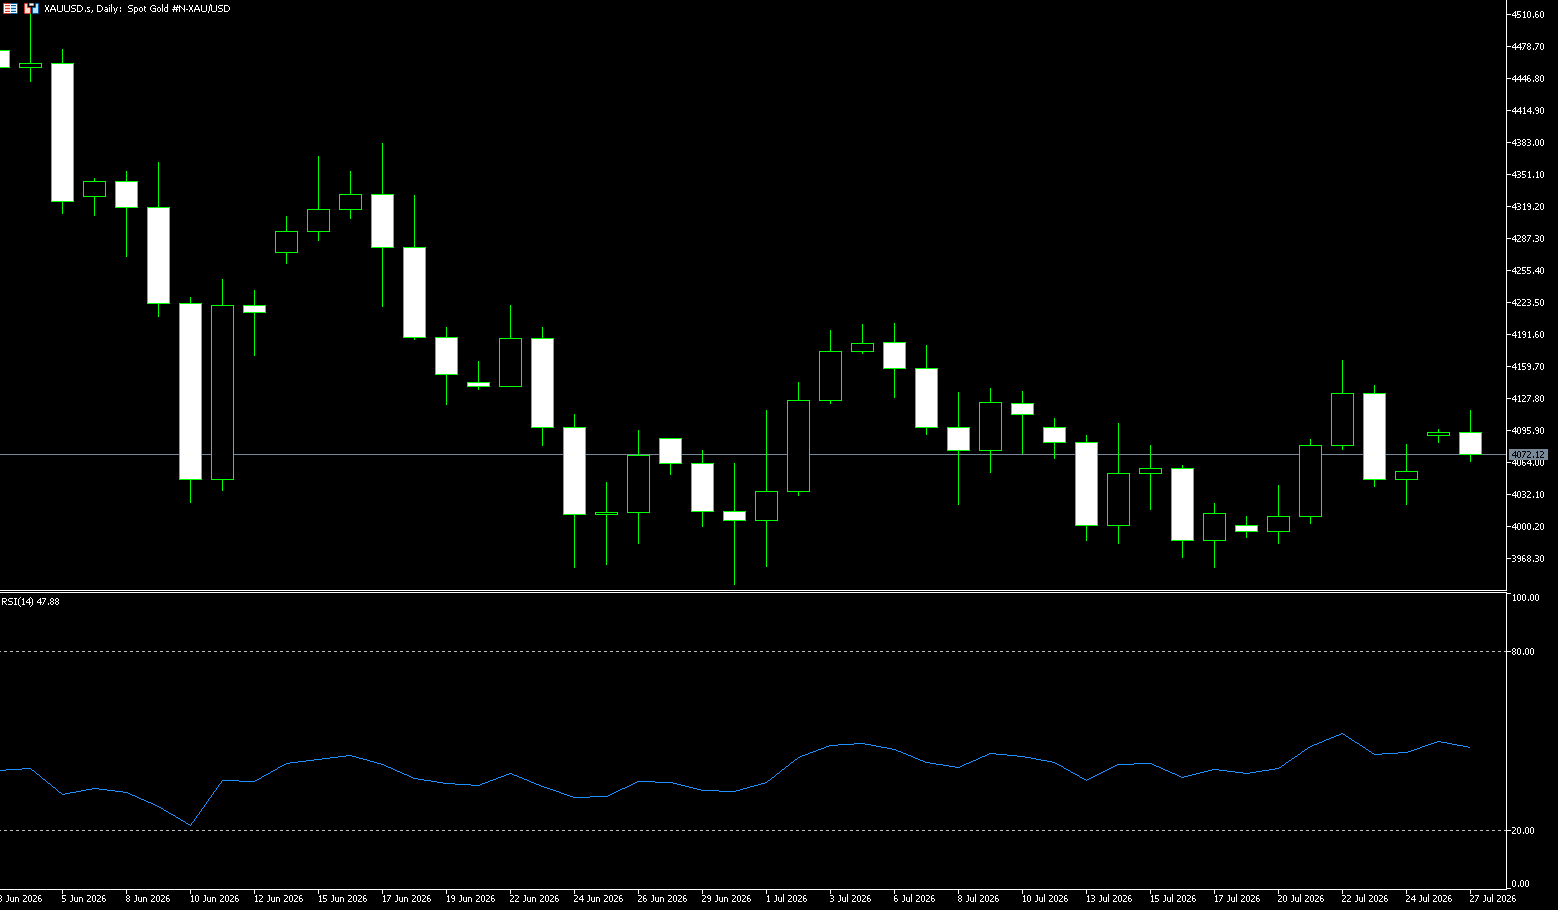
On Monday, spot gold traded slightly below $4,100 per ounce, supported by bargain hunting as the market awaited the Fed's interest rate decision this week to assess the latest developments in the Middle East conflict and its impact on inflation. Spot gold closed last week at $4,052, a period marked by uncertainty. At the beginning of the week, gold prices tested the $4,000 level again, triggering a round of bargain hunting, with prices rebounding to around $4,166. However, the rebound failed to hold, and prices were ultimately pushed back below the 20-day moving average to close. A strong US dollar and persistently high US Treasury yields together formed an upper barrier suppressing gold prices. A survey last week covering 18 professional analysts and 249 retail investors revealed a wide range of divergences, enough to make any one-sided bet uneasy. Technical signals are equally ambiguous – the MACD death cross is exerting downward pressure, while the KDJ has quietly slipped into oversold territory. Faced with the dual uncertainties of the Fed's interest rate decision and the Middle East situation, institutions have collectively adopted a defensive stance, while retail investors have cast a vote completely opposite to that of the institutions with their real money.
Net long positions in gold increased by 4,438 contracts to 123,586 contracts. Amidst fluctuating risk aversion and interest rate expectations, continuous capital inflows into gold indicate that speculative groups remain willing to hold risk-averse assets. Looking at the weekly chart, gold has fallen by nearly 30% this year, with a clear downward trend. However, in the past four weeks, the bears have consistently failed to push gold prices effectively below the $4,000 level and sustain their decline. Meanwhile, weekly trading volume in gold has continued to shrink, which is completely inconsistent with the typical volume and price characteristics of a deep bear market. Technically, there is reasonable room for a corrective rebound. From a purely technical perspective, a pullback to around the $4,000 level would likely trigger a small rebound. However, for the rebound to continue, both a weakening of oil prices and a cooling of the US dollar index are needed simultaneously. Therefore, the upside targets are $4,166 (last week's high) and the $4,200 (psychological level); the downside targets are $4,052.30 (9-day moving average) and $4,000 (psychological level for bulls and bears).
Today, consider going long on gold at $4,067, with a stop loss at $4,060; targets: $4,110; $4,120.
AUD/USD
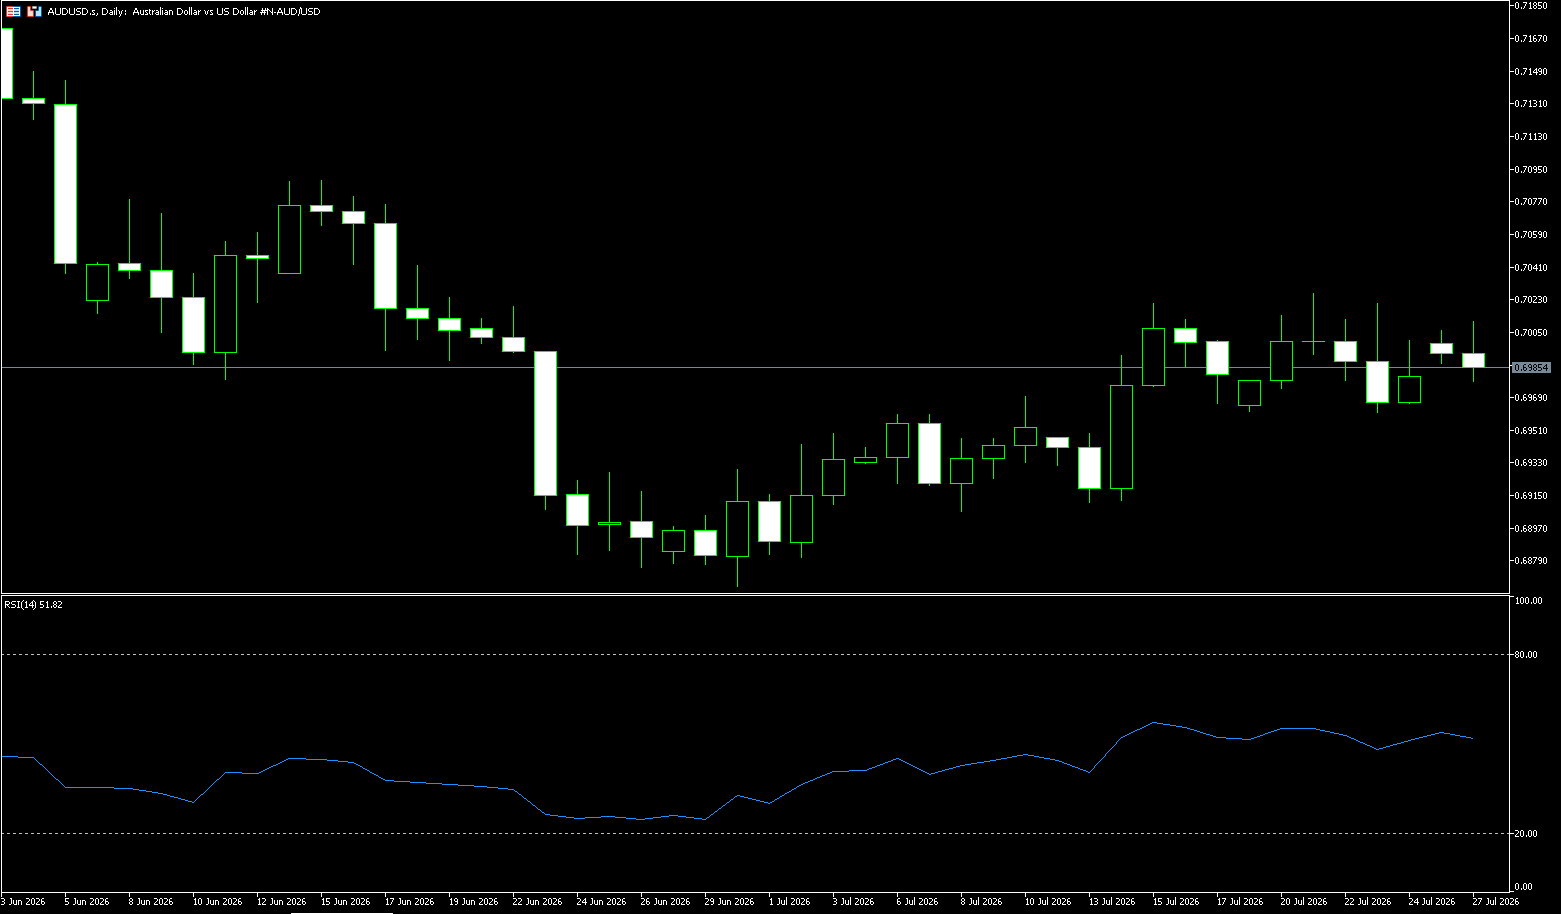
On Monday during the Asian session, the AUD/USD pair continued its upward trend for the second consecutive trading day, hovering around 0.7000. The pair strengthened as the US dollar weakened along with a sharp drop in oil prices. The US decided against launching an attack on Iran over the weekend, and Tehran suspended its retaliatory strikes. However, market participants remained cautious about potential supply disruptions after the Iranian-backed Houthi rebels in Yemen claimed responsibility for attacks on Saudi Arabian facilities along the Red Sea coast. In addition to geopolitical developments, investors are also preparing for the upcoming Federal Reserve policy meeting. The market widely expects the Fed to keep interest rates unchanged on Wednesday and resume rate hikes in September, although a few market participants still anticipate surprises at this week's meeting. Meanwhile, strong Australian employment data for June reinforced market expectations of further monetary tightening by the Reserve Bank of Australia. Investors are now closely watching June and second-quarter inflation data to be released later this week, as persistent price pressures continue to dominate the local outlook.
The Australian dollar rose slightly against the US dollar to the psychological level of 0.7000, hovering around the 9-day simple moving average of 0.6993, a key support level for the recent trend. The currency pair consolidated after rebounding from the late January low of 0.6636, with the 14-day Relative Strength Index (RSI) remaining above 50 at around 53, reinforcing a neutral stance and suggesting balanced but still fragile momentum. The MACD indicator's DIFF line is close to the zero line, with the red bars slightly expanding, indicating a continued convergence of bearish momentum and a moderate recovery in bullish strength. A break above the July 21 high of 0.7027 could trigger a new upward move towards 0.7100 for the Australian dollar against the US dollar. On the downside, a break below the 20-day simple moving average at 0.6960 would target the pair, followed by the psychological level of 0.6900.
Consider going long on the Australian dollar today at 0.6978, with a stop-loss at 0.6968 and targets at 0.7020 and 0.7030.
GBP/USD
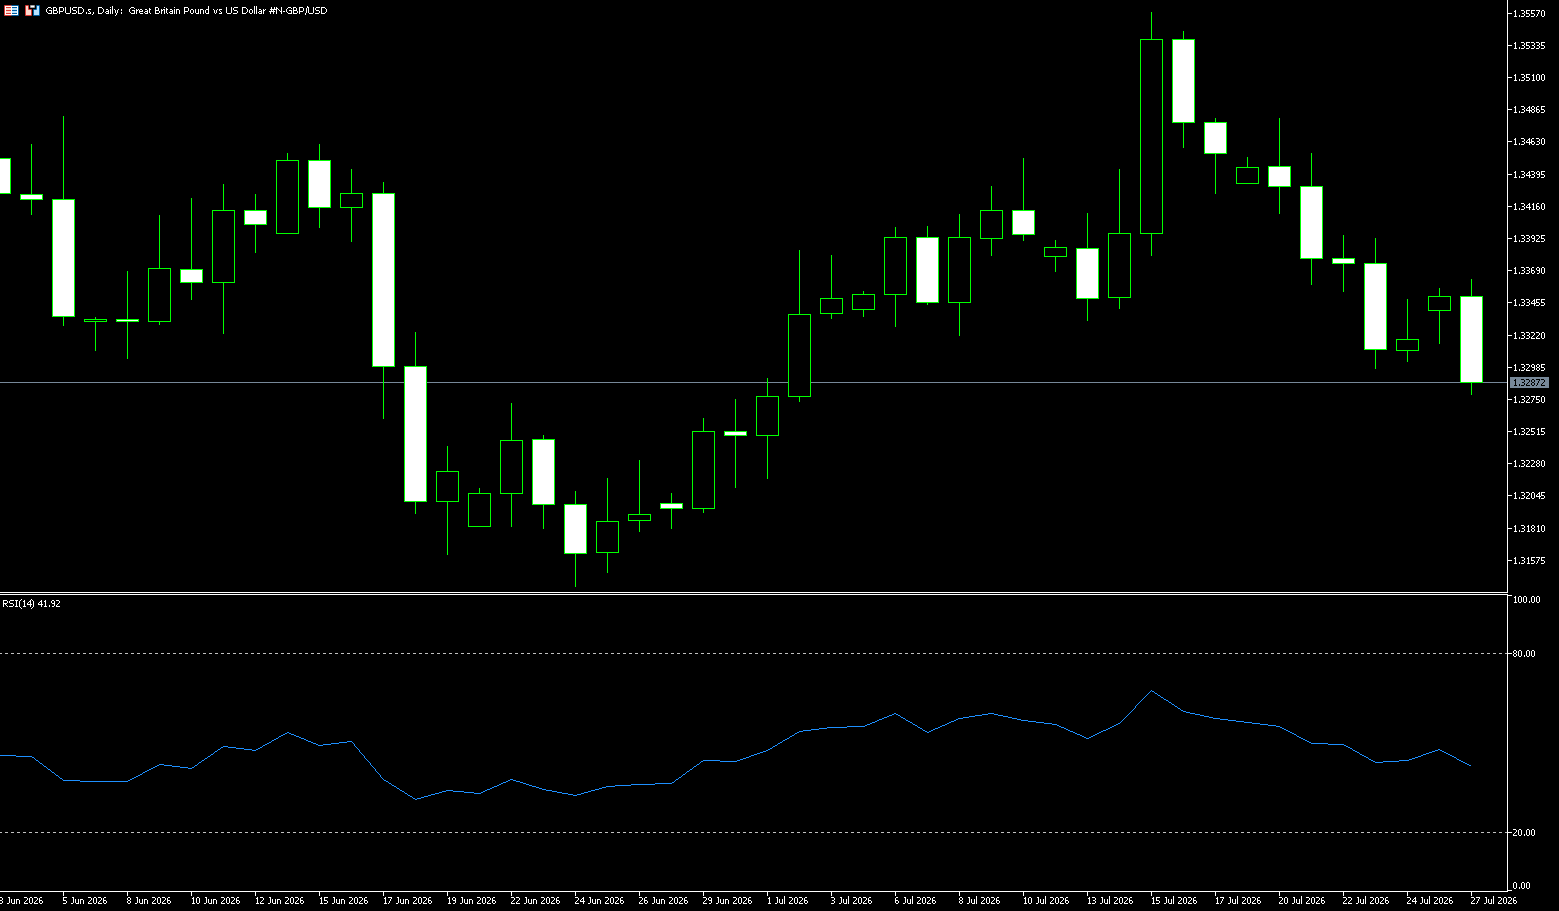
Despite the US dollar being flat today, the pound fell 0.13%. News that a Chinese state-owned company is producing chip manufacturing equipment dampened market risk appetite, prompting a sell-off in Netherlands-based ASML. The pound/dollar pair is currently trading at 1.3295 after hitting a high of 1.3363. Furthermore, recent developments led to a sharp drop in oil prices and eased inflation concerns, cooling bets on a Fed rate hike and further pressuring the dollar. Additionally, the market is awaiting the outcome of the two-day FOMC meeting. Investors will be looking for more clues about the Fed's policy path, which, along with geopolitical developments, will drive the dollar and provide some meaningful upward momentum for the pound/dollar.
The British pound has retreated from a high of 1.3558 against the US dollar, currently trading at 1.3295, neutral to slightly weak, making it the worst-performing non-US dollar currency. The pair broke through the downtrend resistance line from the May high, but remains capped below the 200-day simple moving average at 1.3398. A break above this level would target the highs of June 15th and July 10th, around 1.3455. Momentum indicators on the daily chart are neutral to slightly bullish, with the Relative Strength Index (RSI) hovering above 49 and the Moving Average Convergence Divergence (MACD) in positive territory, indicating short-term bearish dominance but limited momentum. On the downside, the bottom of the trading range over the past two weeks at 1.3330 could pose a challenge to the bears. Further down, the initial targets are 1.3298 (last week's low), which has already been broken, and 1.3300 (a psychological support level); while the highs of June 22nd and 30th around 1.3270, and the 1.3250 level will become the next targets.
Today, consider going long on GBP at 1.3280, with a stop loss at 1.3270 and targets at 1.3320 and 1.3330.
USD/JPY
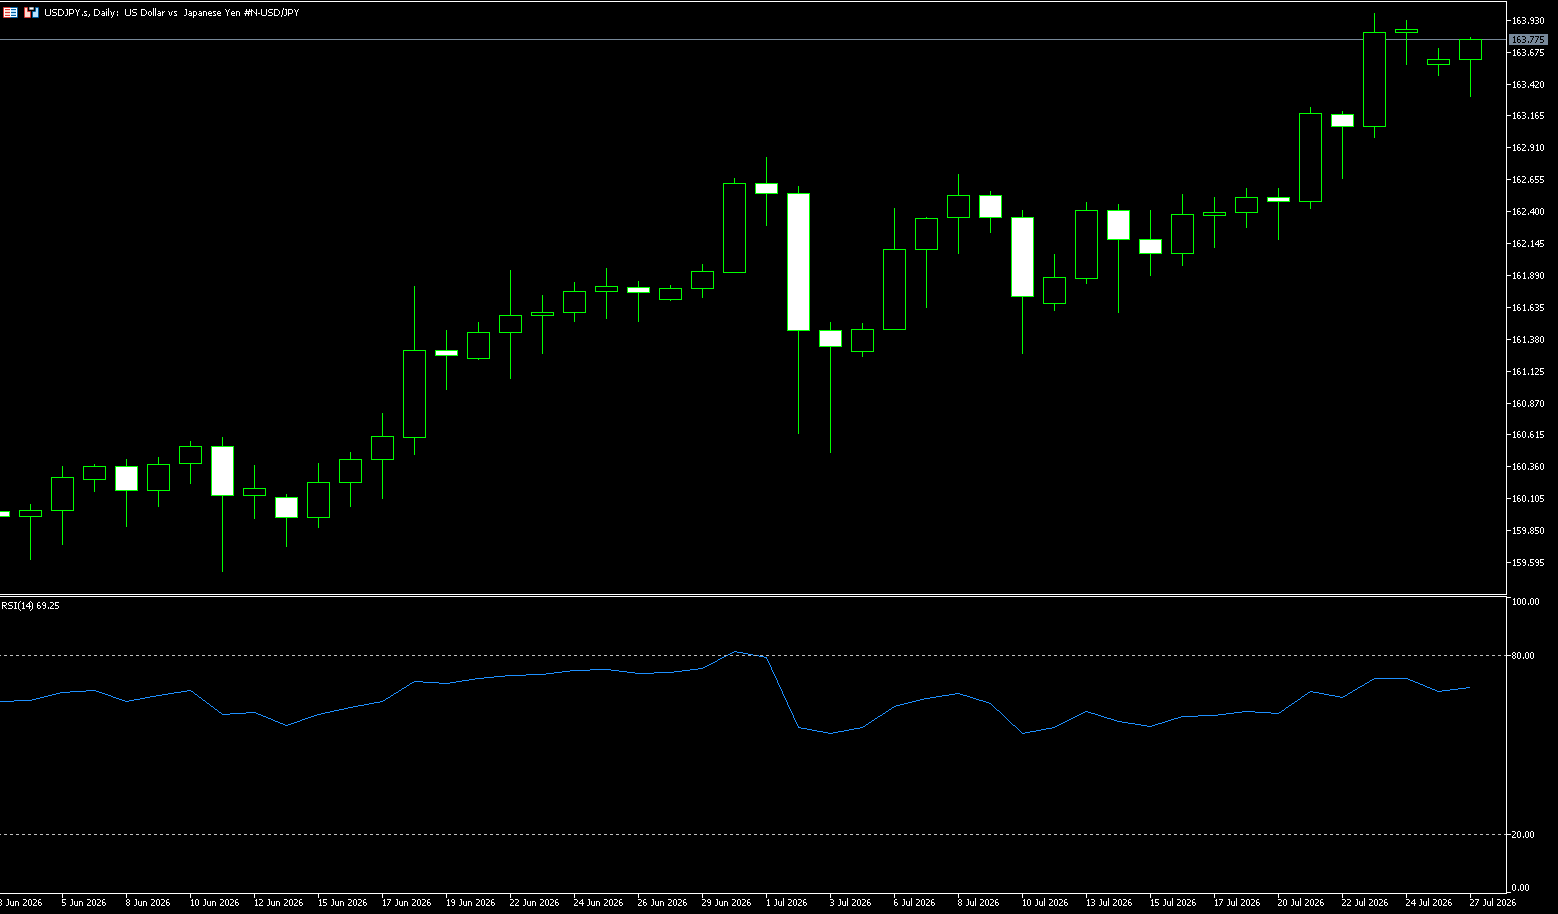
Currently, policy maneuvering surrounding the yen has clearly intensified. Japanese Finance Minister Satsuki Katayama reiterated on Friday that the government is prepared to take action in the foreign exchange market, but the market has shown signs of fatigue with such verbal statements. The US Treasury also unusually joined the pressure on Thursday, urging the Bank of Japan to raise interest rates and warning that excessive exchange rate volatility is undesirable. However, data from well-known foreign media outlets shows that the market has completely ruled out the possibility of the Bank of Japan raising interest rates at next week's policy meeting. Verbal intervention without monetary policy support continues to have diminished effectiveness. The Japanese yen is a low-yield currency, and rising oil prices are impacting its terms of trade. In this environment, the yen is the most natural target for speculators looking to attack any currency. This is the fundamental logic behind the strong performance of the USD/JPY pair since the outbreak of the Iran-Iraq War and rising oil prices. Therefore, without a more aggressive interest rate hike path from the Bank of Japan, intervention alone is unlikely to reverse the trend.
The USD/JPY pair has been steadily rising from a low of 152.10 at the beginning of the year to a high of 164, currently trading at 163.70, having broken through the 163.52 (5-day moving average) and approaching the upper Bollinger Band at 163.93, reaching a new high for the period. The MACD golden cross continues, with the DIFF above the DEA, and the red bars weak but the bullish trend intact. The weekly gain is 0.89%, having touched 164.00 last week, its strongest level since November 1986. Despite repeated verbal interventions by Japanese authorities, the yen is still poised to record its largest weekly decline since mid-May. From a daily chart perspective, USD/JPY remains in a clear uptrend, consistently trading above major moving averages, indicating bulls are controlling the market. Currently approaching the key psychological level of 164.00, resistance is seen in the 164.50-165.00 area; a break above this level could lead to further testing of previous highs. Support levels to watch are first at 162.84 (early this month high) and then at the 162.00 (psychological level). A break below this area could weaken the short-term uptrend.
Today, consider shorting USD at 164.00, with a stop-loss at 164.20 and targets at 163.20 and 163.10.
EUR/USD
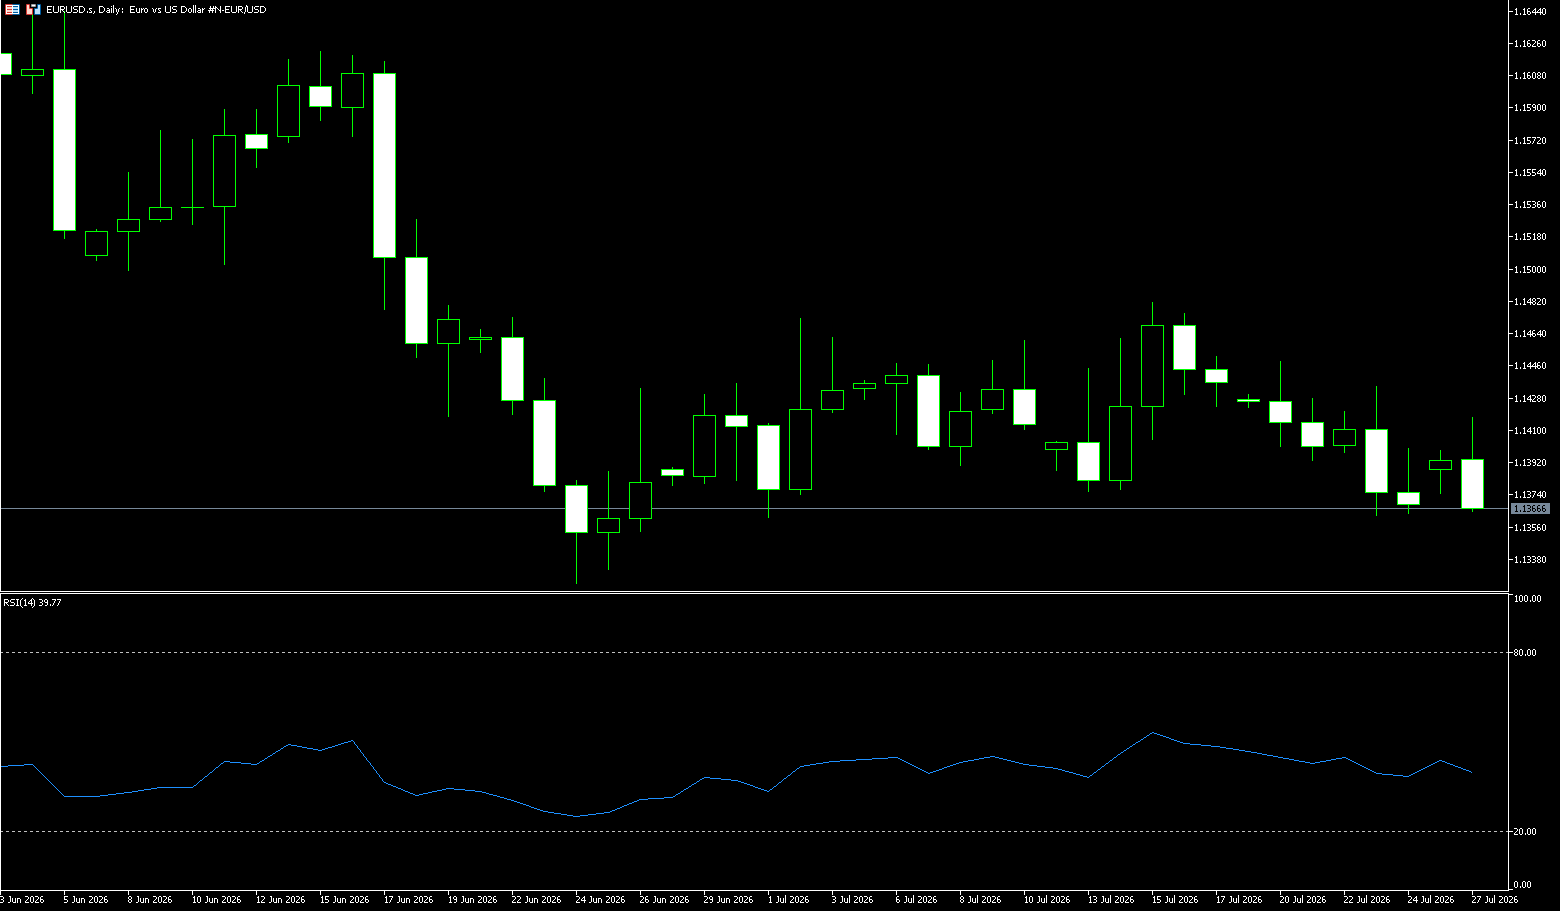
Last week, the ECB kept interest rates unchanged while retaining the possibility of a September rate hike. ECB Chief Economist Lane stated that the central bank still considers the current inflation shock to be moderate, requiring some policy action but not aggressive measures, and expects inflation to return to the 2% target within about a year. This relatively mild statement failed to provide effective support for the euro. Data from well-known foreign media outlets shows that traders currently believe there is a 70.8% probability of a September rate hike by the ECB, but this expectation has not translated into buying of the euro. The euro faces a double dilemma: on the one hand, energy price shocks are more damaging to the European economy than to the US; on the other hand, the ECB's rate hike pace is considered lagging and insufficient. These two factors combined place the euro in a relatively passive position during a period of dollar strength.
On the daily chart, EUR/USD is trading around 1.1370, but the short-term bias remains bearish. Holding below the 34-day moving average of 1.1440 and the 45-day simple moving average of 1.1480 strengthens the resistance above. The 14-day Relative Strength Index (RSI) is around 46, not overbought, and there are no conditions for a trend reversal; it remains below the medium-term moving average, suggesting continued downward pressure, but has not yet entered oversold territory. On the downside, immediate support is currently clustered around 1.1368 and 1.1366. A break below this area would open the door for a continuation of the recent downtrend. At the beginning of the week, EUR/USD rebounded well, but there is a risk of a pullback after the initial surge, and a need for a retracement to confirm support. The pair has held above 1.1364 (last week's low) and 1.1324 (June 24th low), and the bullish structure remains intact; however, multiple bearish divergences on the 4-hour chart suggest caution regarding a short-term pullback.
Today, consider going long on EUR/USD at 1.1358, with a stop-loss at 1.1346 and targets at 1.1410 and 1.1400.
Stock Analysis:
Australian ASX 200 Stock Index
Basic Market Overview:
The Australian Securities Exchange (ASX) 200 index rose 122 points, or 1.4%, to close at 8,894 on Monday, reversing earlier losses as US futures rebounded and oil prices declined due to easing geopolitical tensions. Locally, Australia's rapid Purchasing Managers' Index (PMI) data showed that service sector activity expanded at its fastest pace in six months in July, while factory output saw its biggest increase this year. In major trading partner China, industrial profits grew by 18.7% year-on-year in the first half of the year, remaining stable although slower than the growth rate from January to May. However, market sentiment weakened due to cautious expectations regarding Australian inflation data for June and the second quarter, with investors expressing concerns about persistent price pressures.
All sectors rose, with technology, business services, non-energy mining, and processing sectors leading the gains. Capricorn Metals shares surged 14.3% after its gold reserves increased by 33% to 5.24 million ounces. Shares of the four major banks rose between 1.1% and 1.5%, with BHP (2.2%), Goodman Group (3.3%), Aristocrat Leisure (2.1%), and Evolution Mining (2.0%) being among the top performers.
Leading Sectors (Ranked by Gains)
1. Information Technology (IT) +2.15% [Strongest Performer] Leading Stocks: WiseTech Global (WTC) +7.0%, Xero (XRO) +6.0%, NextDC (TNE) +3.0%
2. Non-Energy Mining (Resources) +1.82% Leading Stocks: BHP +2.2%, Evolution Mining +2.0%, Northern Star +3.2%; Capricorn Metals surged 14.3% (gold reserves revised upward)
3. Communication Services +1.41%
4. Financial Sector +1.19% (Weighted Support for Index) Big Four Banks rose 1.1%~1.5%; Macquarie and insurance stocks also strengthened
5. Industrial/Real Estate REITs Goodman Group (GMG) +3.3%, Airline Stocks QAN +3.6% (Lower oil prices benefit airlines)
Leading Declining Sectors (Only Declining Sector)
Energy Sector (Oil & Gas) -2.99% [Only Declining Sector]
Reason for Decline: De-escalation of Middle East conflict, significant pullback in international crude oil prices. Key Declining Stocks: Santos (STO) -4.3%, Woodside Energy (WDS) -4.1%
Other Sectors: Consumer Discretionary (+0.81%), Consumer Staples (+0.68%), Utilities (+0.40%) all saw slight gains.
Technical Analysis:
The Australian Securities Exchange (ASX) 200 index rose 122 points, or 1.4%, to close at 8,894 on Monday. Monday's rebound was driven by a recovery in sentiment, boosted by easing Middle East tensions, a sharp drop in oil prices, and stronger US stock futures. Positive Australian PMI data also boosted domestic demand expectations. The rebound was broad-based, but trading volume did not increase significantly. The market is awaiting this week's Australian Q2 inflation data, limiting the aggressive upward momentum of the bulls. Daily chart: The index has rebounded from its lows, with prices regaining above the 5-day moving average. The RSI has risen to around 56, moving out of oversold territory but not yet into overbought territory, indicating a short-term recovery in bullish momentum. The MACD histogram continues to contract, suggesting a potential golden cross. This rebound is driven by sentiment and is not a new round of strong, one-sided bull market. If the index cannot sustain its position above 8920, it is likely to fall back and test the 8800 level again; be wary of a "one-day wonder" rebound.
Trading Strategies:
The following are technical trading ideas only and do not constitute investment advice. Leveraged trading may result in losses exceeding the principal.
Buy Strategy (Preferred):
1. Buy on Pullback: If the price retraces and stabilizes around 8840, consider a small long position. Target 1: 8900; Target 2: 8955. Stop Loss: Exit if the price breaks below 8790.
2. Buy on Breakout (Caution): If the price effectively holds above 8920, add to the long position, targeting 8955-8960. If the price fails to hold above 8900, be wary of a pullback.
Short-selling strategy (only trading on pullbacks under pressure, not actively predicting tops)
1. Short on rallies under pressure: If the price repeatedly fails to break through the 8900-8920 range and shows a bearish divergence signal, consider a small short position. Target: 8840. Stop loss: Exit at 8930.
Key risk warnings:
Australian Q2 inflation data is about to be released. If inflation is higher than expected, the market will revise the probability of a Reserve Bank of Australia (RBA) rate hike, directly suppressing Australian stocks and impacting the banking and growth sectors; a significant cooling of inflation would benefit risk assets.
The situation in the Middle East has changed again, causing a rapid rebound in oil prices and pushing up global inflation expectations.
The Fed's interest rate meeting is approaching, increasing volatility in US stocks, and risk appetite is repeatedly transmitted to the Asia-Pacific market.
Chinese domestic demand and iron ore price fluctuations continue to affect Australian resource giants (BHP, RIO).
Japanese Stock Index (JP225)
Basic Market Overview:
The Nikkei 225 index rose 0.5% to close at 64,931 points, while the broader Topix index gained 1.37% to 4,066 points, recovering some of the previous day's losses on Monday as oil prices fell sharply after the US did not take military action against Iran over the weekend, while Tehran also paused its retaliatory actions. Japan's heavy reliance on Middle Eastern oil imports makes its economy particularly sensitive to supply disruptions and fluctuations in crude oil prices. Domestically, Prime Minister Sanae Takashi's approval rating declined as the government's measures to alleviate inflation have yet to meet household expectations.
In terms of individual stocks, Mitsubishi UFJ (up 1.2%), Sumco (up 3.8%), Nintendo (up 6.6%), Toyota Motor (up 2.4%), and Fast Retailing (up 1.5%) all performed well. Meanwhile, technology stocks mostly fell after Friday's tech sell-off on Wall Street, fueled by heightened concerns about massive artificial intelligence spending.
Sector Performance:
Leading Sectors:
Air Transportation (Benefiting from falling oil prices) Representative Stocks: Japan Airlines, ANA
Comprehensive Services, IT Consulting Services Leading Component Stocks: Shift, Bay Current Consulting (The two stocks with the largest intraday gains)
Real Estate, Banking & Finance
Rubber Products, Automobiles (Toyota, Subaru), Cultural & Entertainment Consumption (Nintendo, Shiseido)
Lowering Sectors (Only 4 sectors closed lower throughout the day):
Petroleum & Coal Products, Mining, Non-ferrous Metals (Resources Sector) The sharp drop in oil prices suppressed profit expectations for energy and resource companies.
Basic Chemical Raw Materials Sector
Technical Analysis:
After a significant correction last Friday, the Nikkei 225 index rebounded on Monday, but the selling pressure above has not been fully digested. Currently, it is in a weak, range-bound consolidation pattern, and the short-term consolidation structure has not yet been reversed. The index is trading below the 20-day moving average, and the rebound is a technical oversold correction; the bulls have not yet formed sustained upward momentum. Technical indicators: RSI: Rebounded from a low to the neutral zone, not yet overbought, indicating potential for continued rebound, but upward momentum is limited. MACD: Bearish momentum is narrowing, but a golden cross has not yet formed, suggesting the rebound will primarily be a period of consolidation and correction, unlikely to see a direct, one-sided surge. Market structure reminder: The Nikkei 225 is a price-weighted index; SoftBank, Tokyo Electron, and semiconductor stocks have a strong influence on the index, and sector divergence will amplify index volatility. If the market opens with continued sideways movement within a narrow range of 64800-65400, do not open positions prematurely; wait for a breakout before entering. A sustained move above 66700 is needed to establish a bullish trend; a break below 64000 will open up significant downside potential; maintain a range-bound trading strategy until a breakout occurs.
Trading Strategy:
This information is for market analysis and reference only and does not constitute any trading or investment advice.
Overall Strategy: Range-bound trading; avoid chasing highs and predicting one-sided trends; wait for confirmation of a breakout at key levels.
Option 1: Bullish Strategy (Buy on Dips)
• Entry Conditions: Consider a small long position if the price retraces to the 64500-64700 range and stabilizes, indicating a halt in the decline.
• First Target: 65600; Second Target: 66400
• Stop Loss: Exit if the price breaks below 64200.
Option 2: Bearish Strategy (Sell on Resistance)
• Entry Conditions: Consider a short position if the price rebounds to the 65600-65800 range and encounters resistance, indicating a pullback.
• First Target: 64700; Second Target: 64200
• Stop Loss: Exit if the price holds above 66000.
Key Risk Warning:
External Risk Linkage (Highest Priority) JP225 The Nasdaq is highly correlated with overnight US stocks, especially semiconductor and technology stocks. If the Nasdaq continues to weaken, Japanese technology stocks will be under pressure, suppressing any rebound in the index. After-hours performance of US stocks should be closely monitored.
USD/JPY exchange rate fluctuations: The USD/JPY is highly correlated with the Nikkei 225 in the short term. A rapid appreciation of the yen (and a depreciation of the USD/JPY) will directly negatively impact leading export stocks, putting downward pressure on the index. A break above the 165 level in USD/JPY would raise market concerns about yen instability, triggering capital market volatility.
Bank of Japan expectation risks: The market continues to speculate on the timing of the Bank of Japan's interest rate hikes. If officials release hawkish comments, long-term Japanese government bond yields will rise, suppressing stock market valuations.
Index characteristic risks: The Nikkei 225's price-weighted mechanism means that the rise or fall of a few high-priced, weighted stocks can significantly affect the index, easily leading to index distortion and divergence between individual stocks and the overall market.
Disclaimer: The information contained herein (1) is proprietary to BCR and/or its content providers; (2) may not be copied or distributed; (3) is not warranted to be accurate, complete or timely; and, (4) does not constitute advice or a recommendation by BCR or its content providers in respect of the investment in financial instruments. Neither BCR or its content providers are responsible for any damages or losses arising from any use of this information. Past performance is no guarantee of future results.
Lebih Liputan



Pendedahan Risiko:Instrumen derivatif diniagakan di luar bursa dengan margin, yang bermakna ia membawa tahap risiko yang tinggi dan terdapat kemungkinan anda boleh kehilangan seluruh pelaburan anda. Produk-produk ini tidak sesuai untuk semua pelabur. Pastikan anda memahami sepenuhnya risiko dan pertimbangkan dengan teliti keadaan kewangan dan pengalaman dagangan anda sebelum berdagang. Cari nasihat kewangan bebas jika perlu sebelum membuka akaun dengan BCR.
BCR Co Pty Ltd (No. Syarikat 1975046) ialah syarikat yang diperbadankan di bawah undang-undang British Virgin Islands, dengan pejabat berdaftar di Trident Chambers, Wickham’s Cay 1, Road Town, Tortola, British Virgin Islands, dan dilesenkan serta dikawal selia oleh Suruhanjaya Perkhidmatan Kewangan British Virgin Islands di bawah Lesen No. SIBA/L/19/1122.
Open Bridge Limited (No. Syarikat 16701394) ialah syarikat yang diperbadankan di bawah Akta Syarikat 2006 dan berdaftar di England dan Wales, dengan alamat berdaftar di Kemp House, 160 City Road, London, England, EC1V 2NX. Open Bridge Limited bertindak semata-mata sebagai pemproses pembayaran untuk BCR Co Pty Ltd dan tidak menyediakan sebarang perkhidmatan kewangan, perdagangan atau pelaburan bagi pihaknya. Peranan Open Bridge Limited adalah terhad kepada pemprosesan pembayaran.


 English
 简体中文
简体中文
 繁體中文
繁體中文
 Bahasa
Melayu
Bahasa
Melayu
 Tiếng
Việt
Tiếng
Việt
 ไทย
ไทย
 日本語
日本語
 한국어
한국어
 ភាសាខ្មែរ
 español