


0
Currency & Commodity Analysis:
US Dollar Index
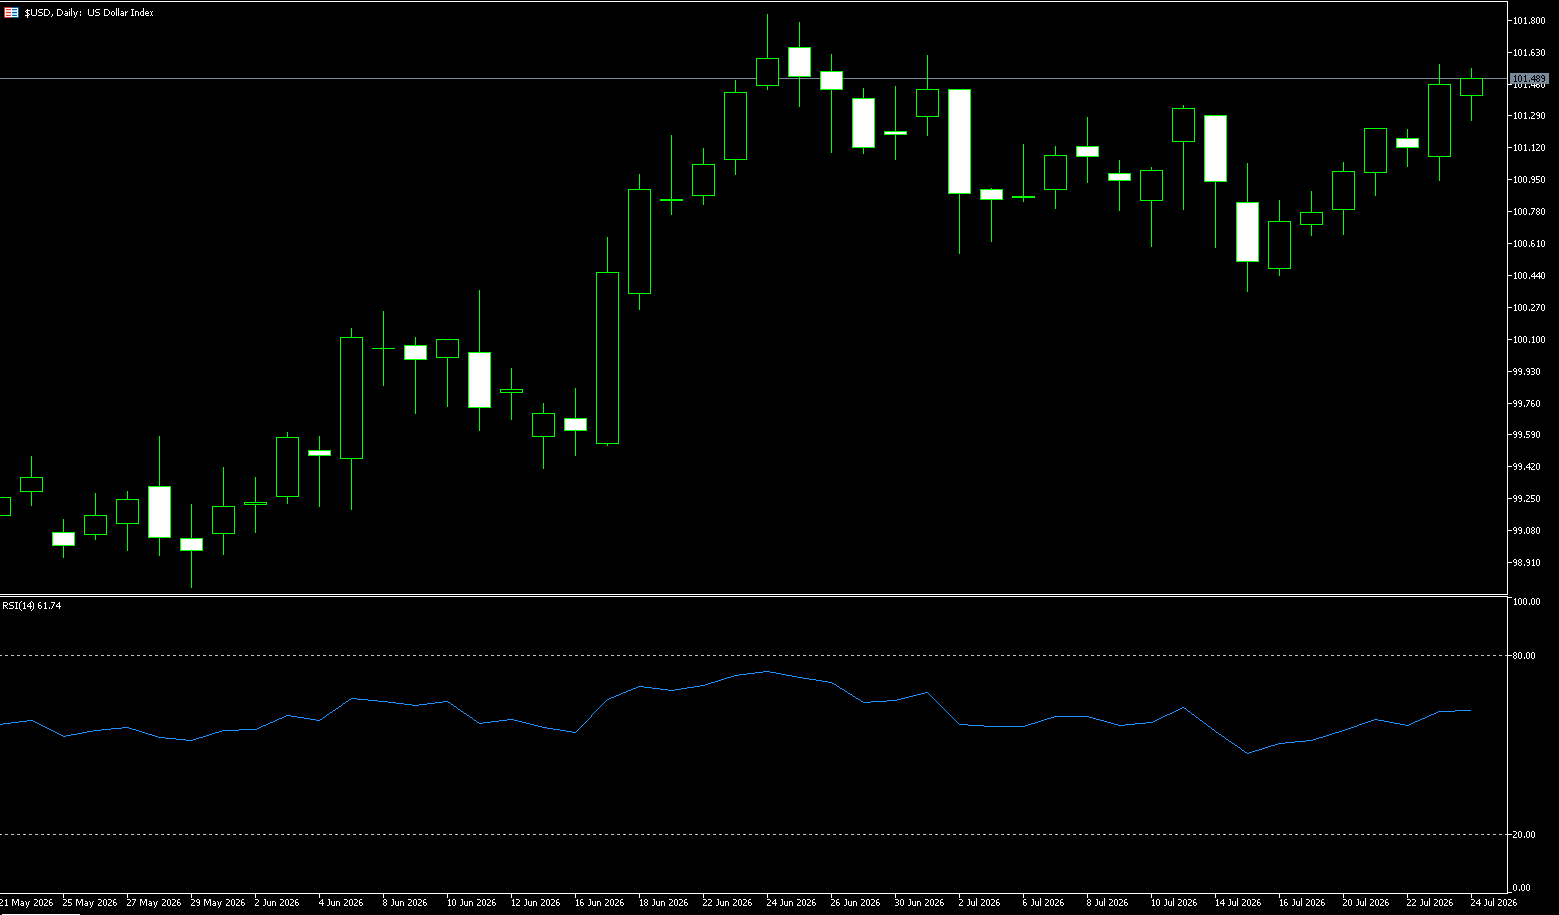
The dollar index traded near a three-week high of 101.54 last week as new tariffs imposed by US President Trump on major trading partners heightened concerns about the re-establishment of tariff barriers. Under the new framework, imports from countries including Mexico, Canada, the UK, and India will face a 10% tariff related to forced labor, while goods from the EU and Taiwan will be capped at 10%. Products from Japan, South Korea, and Switzerland will typically face tariffs as high as 12.5%, with additional charges on some goods. The dollar also received support as escalating tensions in the Middle East drove up energy prices, and the US labor market remained strong, with rising expectations of a tightening Federal Reserve policy. The swap market currently prices a roughly 34% probability of a Fed rate hike next week, fully pricing in at least one hike in September, with the possibility of another hike before the end of the year.
The dollar index, which tracks the dollar's performance against a basket of currencies, gave back some of its strong gains near its monthly high before the weekend. The index is currently trading in the 101.30-101.25 range, but downside appears limited in a constructive environment. The day's gains may be attributed to some profit-taking ahead of the weekend and some position-correcting ahead of next week's key FOMC policy meeting. However, any meaningful pullback remains unlikely, as persistently high oil prices continue to exacerbate inflation concerns and reinforce expectations of at least one more rate hike by the Federal Reserve. Furthermore, escalating tensions between the US and Iran and President Donald Trump's imposition of new comprehensive tariffs have dampened investor sentiment, potentially providing further support for the safe-haven dollar.
From a technical perspective, the short-term tone is bullish, as the dollar index has been holding firmly above its 50-day simple moving average (currently at 100.34) on the daily chart since mid-May. Additionally, the day's pullback stalled near the 23.6% Fibonacci retracement level of the rally from the July lows. Momentum indicators also support this constructive bias. The Relative Strength Index (RSI) hovered around 60 on the 14th, and the Moving Average Convergence Divergence (MACD) indicator remained slightly positive, but its flattening pattern suggested that upward momentum might be slowing as the index approached higher levels. Technically, it exhibited a range-bound upward trend, lacking a clear one-sided extreme bullish bias, and more likely to consolidate at higher levels awaiting the Fed's decision to determine direction.
In the first half of next week, the price is expected to fluctuate within the 101.00 (psychological level) - 101.80 (June 24 high) range, awaiting the Fed's decision on Wednesday. However, the broader technical picture indicates that buyers remain dominant, and any technical pullback is likely to find support around 101.09 (the 38.2% Fibonacci retracement level) and the 101.00 psychological level, followed by the 50-day simple moving average at 100.34. A deeper pullback would expose the psychological support at 100.00. On the upside, the next resistance level for the bulls is the recent high around 101.55. A sustained break above this level would open up room for the dollar index to continue its rebound to 101.80 (the high on June 24) and the psychological level of 102.00.
Today, consider shorting the US Dollar Index at 101.56, with a stop-loss at 101.66 and targets at 101.10 and 101.00.
WTI Crude Oil
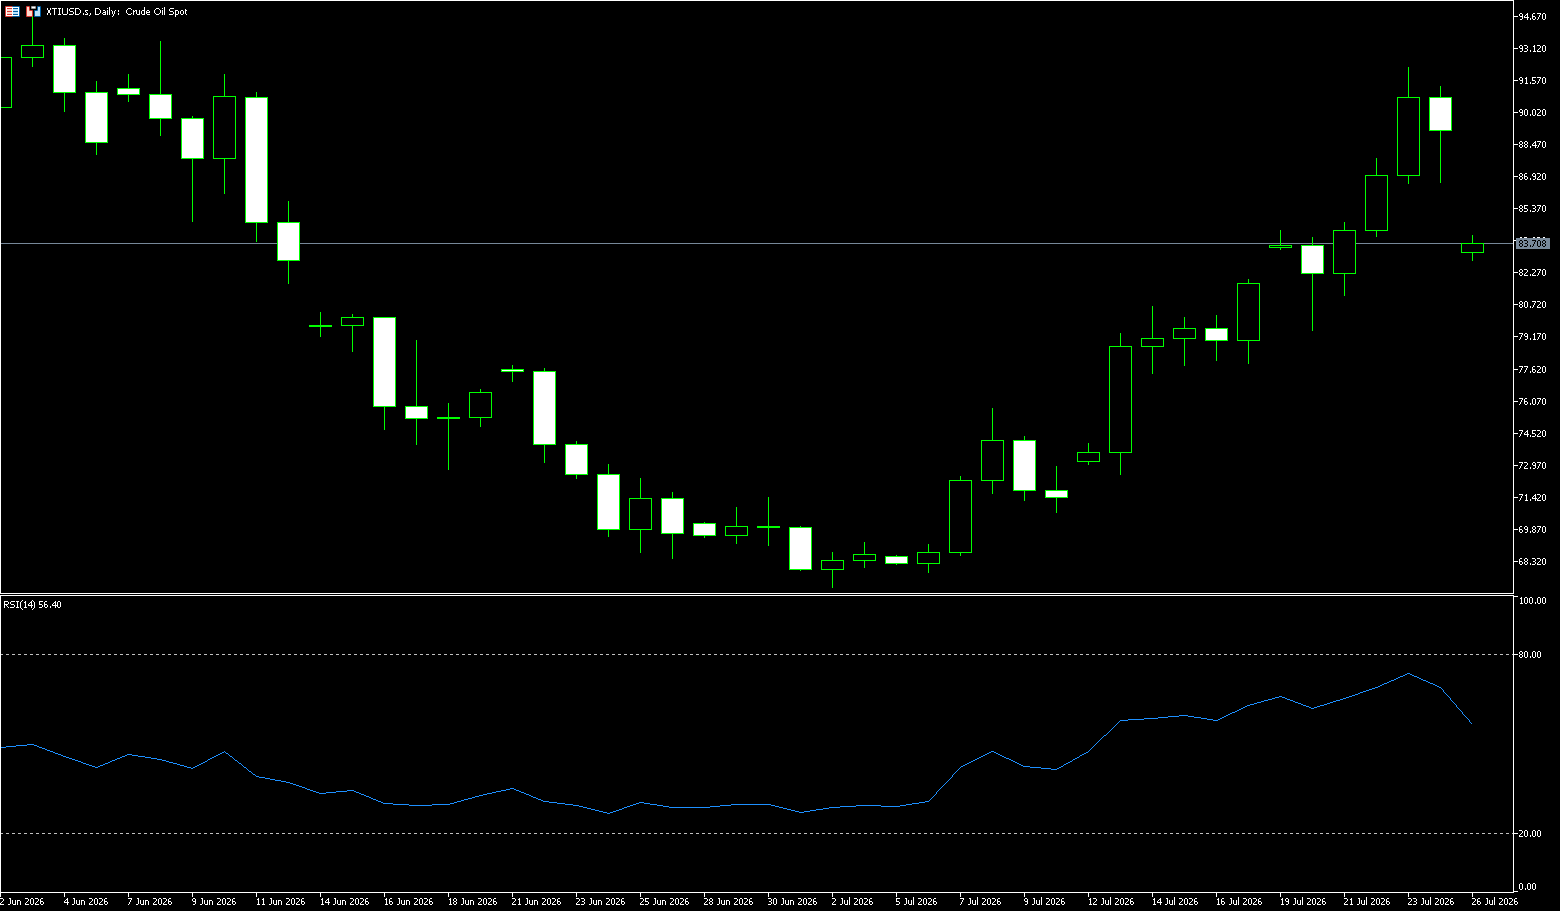
Before the weekend, WTI crude oil prices experienced a technical pullback to around $89.20 per barrel after surging to a near one-and-a-half-month high of $92.50. This followed reports that Pakistan, with Chinese support, sought to resume negotiations between the US and Iran, raising hopes for a diplomatic easing of tensions. According to reports, Chinese officials are increasingly concerned that attacks on Gulf states and disruptions in the Strait of Hormuz are harming their economic interests. Despite the price decline, crude oil is still up about 9% this week after the sharp escalation of hostilities in the Middle East. Last night, US Central Command conducted its 13th consecutive night of strikes against Iran, targeting military infrastructure and maritime capabilities. The US military stated that the waterway remains open with US support. Meanwhile, President Trump warned that he was considering an unprecedented military response against Iran and vowed severe retaliation if Tehran supported further attacks by the Houthis on ships in the Red Sea.
Overall, the current situation in the Middle East presents a complex and intertwined picture of "undercurrents, tense skies, and continued restrictions on both shipping lanes." In the short term (easing concerns triggering an oil price correction): the previous surge was based on extreme expectations of a complete physical blockade of global energy shipping lanes and an out-of-control decisive battle between the US and Iran. However, the Houthis' limited firepower means they cannot truly cut off the Red Sea, while the ongoing communication channels and strategic denials between the US and Iran have preserved a bottom line to prevent a full-scale war. This discrepancy between reality and expectations directly led to a decline in market fear levels, driving a short-term correction in international oil prices due to profit-taking and easing concerns.
The medium-term rebound that began from the early July low of $67.08 continues; last week saw an accelerated rise followed by profit-taking at higher levels. The weekly chart closed with a bullish candle with an upper shadow, indicating strong selling pressure in the $92-$93 range, suggesting short-term bullish momentum is weakening. Next week will likely see a period of consolidation and support level confirmation. The current market is facing multiple negative factors, including the Houthi attacks on Saudi oil tankers in the Bab el-Mandeb Strait and recent strong threatening rhetoric from former US President Trump regarding Iran. These geopolitical conflicts continue to churn the international oil market. From a daily chart perspective, WTI crude oil prices recently broke out of the previous consolidation range and surged, with the moving average system reverting to a bullish alignment, indicating a significant improvement in the medium-term trend. A further break above $95 could open the market to test the psychological barrier of $100. Initial support is around $87; a break below $84 could damage the short-term bullish structure.
Analyzing next week's trend, WTI crude oil prices are expected to maintain a healthy medium-term bullish structure, but the weekly candlestick shows a significant upper shadow, indicating overbought conditions and divergence. A pullback is likely before a directional move, making a sustained surge more difficult. In the short term, the market is expected to shift from a one-sided upward trend to a period of consolidation. The 14-day Relative Strength Index (RSI) has fallen from the overbought zone of 72 to 69, indicating weakening bullish momentum and a potential need for further retracement to correct the indicator. The MACD histogram is shortening, increasing the risk of a bearish divergence. As for moving averages, the system remains bullish, and the medium-term trend has not yet reversed, indicating only a short-term correction. Currently, short-term news is driving volatile price movements; caution is advised against a "profit-taking and rapid sell-off." Therefore, watch the $87.89 (89-day moving average) and $85.84 (65-day moving average) areas below. If the Middle East conflict escalates again over the weekend, and Monday opens higher and holds above the psychological support level of $90, it will challenge last week's high of $92.25, and a break above that would target $94.86 (June 3 high); or even the psychological level of $100.
Today, consider going long on crude oil at $88.90, with a stop loss at $88.70 and targets at $93.00 and $92.00.
Spot Gold
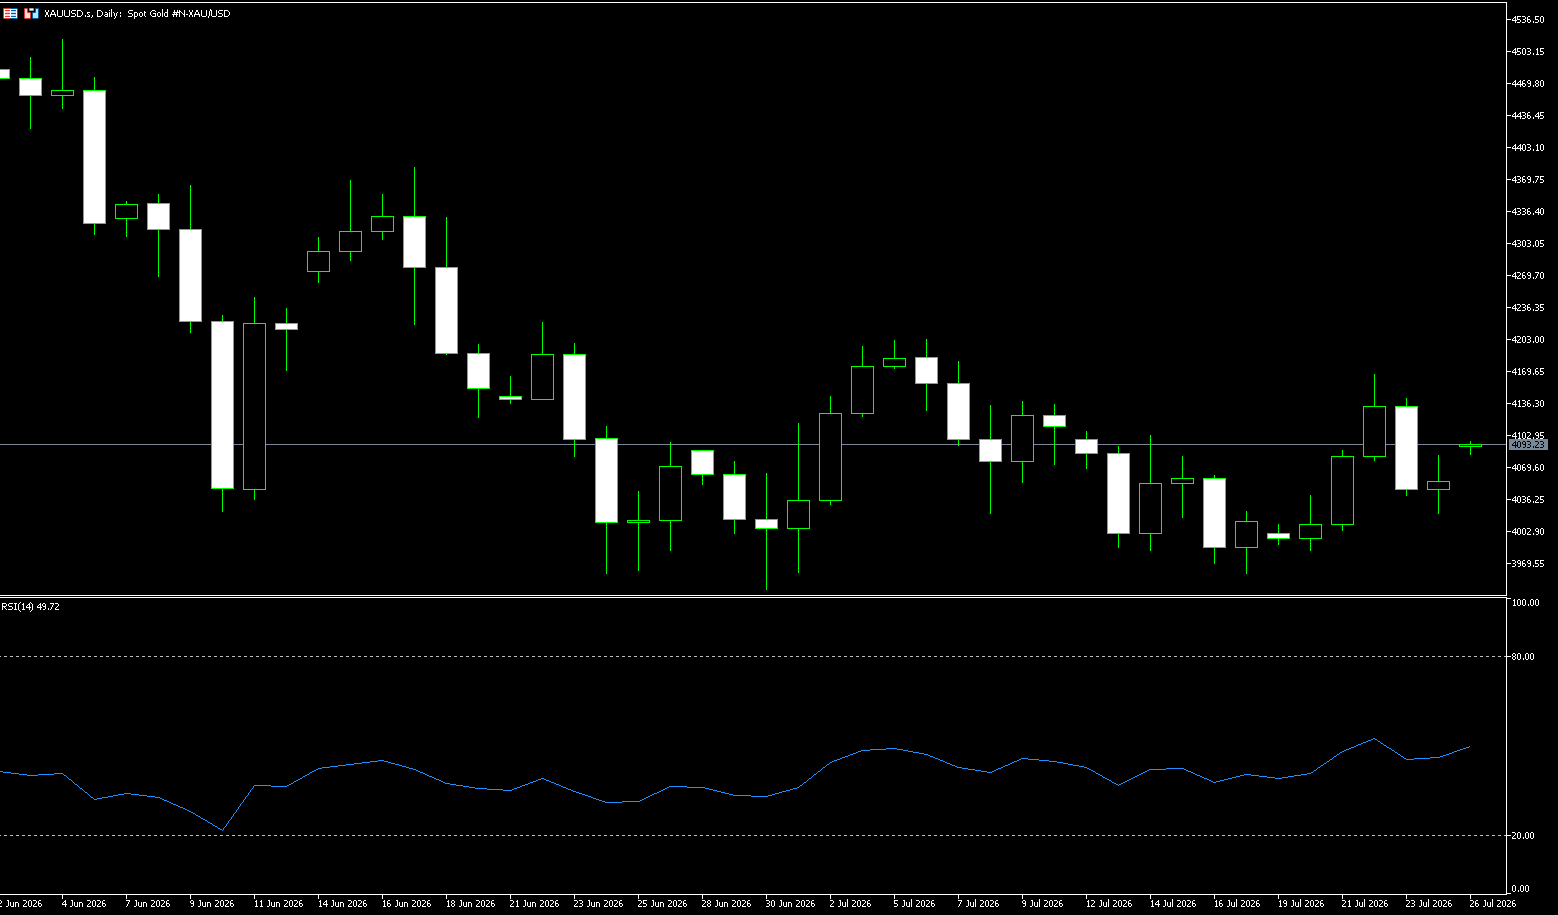
Gold rebounded slightly last week. Before confirming that the pullback from the two-week high of $4,166 reached mid-week has ended and before setting up for any meaningful upward movement, the fundamental background remains warranting caution. Escalating tensions between the US and Iran, coupled with persistently high oil prices, have further exacerbated inflation concerns and reinforced expectations that US interest rates will remain high for an extended period. This could continue to support the dollar and limit the rise of the non-interest-bearing precious metal. Investors remain concerned that high oil prices will reignite inflationary pressures and force major central banks, including the Federal Reserve, to adopt a more hawkish stance. In addition, data released on Thursday showed that initial jobless claims in the U.S. fell to their lowest level since September 1969, indicating that the labor market remains resilient. This should allow Fed officials to continue focusing on curbing inflation, thus supporting the view that there will be at least one more rate hike by the end of the year.
Meanwhile, U.S. President Donald Trump imposed broad new tariffs on 60 of the country's major trading partners, with rates ranging from 10% to 12.5%, covering 99.4% of total U.S. imports. This latest development threatens to reignite a global trade war, dampening investor appetite for risk assets and further strengthening the dollar's status as a reserve currency. This, in turn, supports a pullback in gold from last week's two-week high, with market focus shifting to next week's FOMC meeting.
Last week, gold prices initially rebounded after a period of fluctuation, stabilizing around $3,982.70 at the beginning of the week before rising to a high of $4,166. In late last week, gold prices fell to a low of around 4,020, pressured by soaring oil prices driving inflation expectations, rising expectations of a Federal Reserve rate hike, and a stronger dollar and US Treasury yields. From a technical perspective, gold's failure to break through the 34-day simple moving average of $4,112 (where gold has been below since mid-March) and the subsequent decline indicate that the recent rebound from the $3,980-$3,982 area or monthly low has lost momentum. Furthermore, the MACD indicator is in negative territory with its line depth below zero, while the 14-day Relative Strength Index (RSI) is close to 45, suggesting that downward momentum is still in play.
Meanwhile, the weekly chart has shifted from a corrective rebound to a pullback under pressure, with 4,000 becoming the key watershed between bulls and bears for last week and into next week. A break below the psychological level of $4,000 and the support level of $3,980-$3,982, followed by further selling, would reconfirm the negative outlook and pave the way for a deeper decline to the psychological level of $3,900. Meanwhile, intraday support levels are likely to be determined more by previous price reactions than by mature indicator levels. Initial resistance is defined by the 34-day simple moving average at $4,112; only a sustained break above this medium-term resistance will begin to alleviate current downward pressure and allow for a continued upward challenge of the $4,166 level (last week's high).
Consider going long on gold today at $4,045, with a stop-loss at $4,040; targets: $4,100; $4,120.
AUD/USD
Last week, the Australian dollar traded below US$0.7000, facing its first weekly loss in a month, pressured by a stronger US dollar, while higher oil prices and renewed trade tensions exacerbated inflation concerns. Brent crude prices climbed above US$100 per barrel after Houthi attacks on Saudi oil tankers in the Red Sea, while President Trump threatened further action against Iran. New US tariffs on goods from 60 trading partners fueled inflation concerns and reinforced expectations that interest rates may remain high. A strong US dollar erased the Australian dollar's gains following better-than-expected domestic employment data, while soaring oil prices further supported the Reserve Bank of Australia's (RBA) case for another rate hike. The market currently suggests a 40% probability of the RBA raising the cash rate to 4.35% in August, down from just 10% a few weeks ago, and is expected to be almost fully priced in by November. Investors are now awaiting second-quarter inflation data next week for further clues about the policy outlook.
On the other hand, the US dollar extended its recent strong rally, rising to its highest level since June 26 and becoming a key factor weighing on the Australian dollar/US dollar pair. Escalating tensions between the US and Iran continue to support oil prices to their highest level since June 11, which has been exacerbating inflation concerns and reinforcing bets on a US Federal Reserve rate hike. However, the Australian dollar was supported by better-than-expected preliminary domestic PMI data, showing broader private sector expansion for the second consecutive month. This followed optimistic Australian employment data released on Thursday and reaffirmed bets on further rate hikes by the Reserve Bank of Australia, helping to limit downside for the Australian dollar/US dollar pair.
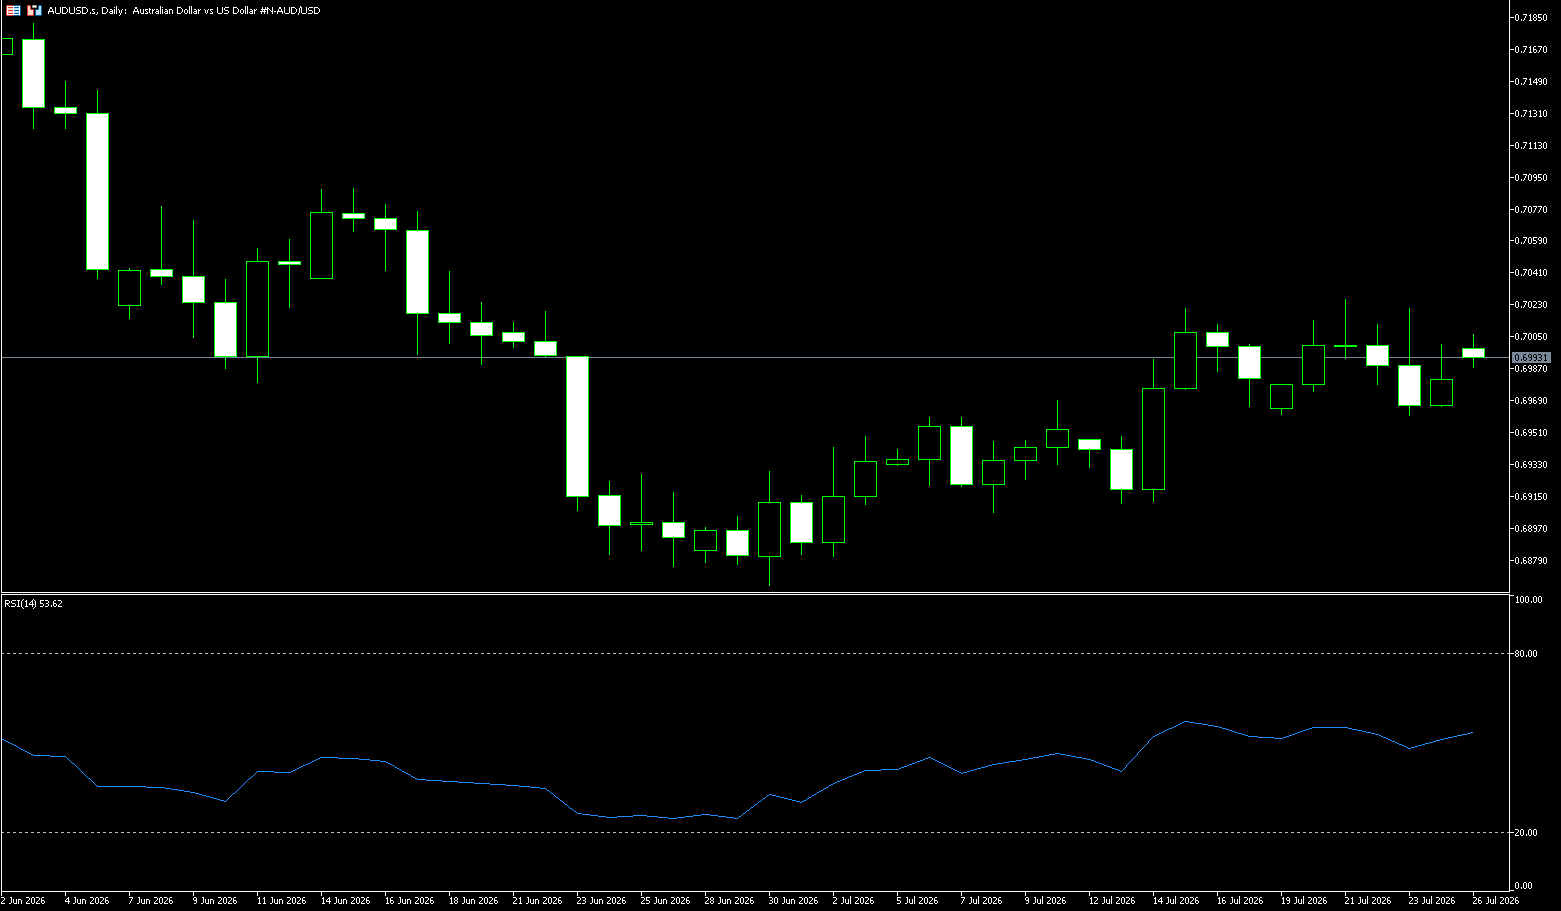
The Australian dollar/US dollar pair fluctuated around the 0.7000 level last week, quickly giving back gains after breaking through that level. So far last week, the pair reached a high of 0.7026 but failed to hold above this key level. Nevertheless, the Australian dollar/US dollar pair has risen for the fourth consecutive week. According to the daily chart, the Australian dollar against the US dollar is currently above the 20-day simple moving average at 0.6954, with the short-term moving average turning from resistance to support. The medium- to long-term trend remains intact, but the short-term high of 0.7088 (the high on June 15th) forms a clear resistance zone. In terms of indicators, the MACD DIFF is close to the zero line, the red bars are expanding slightly, bearish momentum continues to converge, and bullish strength is recovering moderately, but a strong bullish signal has not yet formed. The RSI has stabilized above the 50 level (49.68), breaking out of the previous oversold zone, giving bulls a slight advantage in the short term, but it has not yet entered overbought territory, leaving room for further upward movement.
Last week, the Australian dollar against the US dollar formed a rising low channel from its lows, but repeatedly encountered resistance at the 0.7000 level, entering a range-bound pattern. Next week, it will likely await a breakout driven by news. Currently, initial support is at 0.6913 (July 13 low), while the 200-day simple moving average near 0.6898 remains a key area. As long as this level holds, the broader bullish structure remains intact, but a convincing break above 0.7000 (psychological level) and 0.7026 (last week's high) may require a sustained decline in US inflation, a more dovish stance from the Federal Reserve, or a substantial improvement in global risk appetite. A break below these levels would target 0.7058 (100-day simple moving average) and the 0.7100 (psychological level).
Consider going long on the Australian dollar today at 0.6970, with a stop-loss at 0.6960 and targets at 0.7020 and 0.7030.
GBP/USD
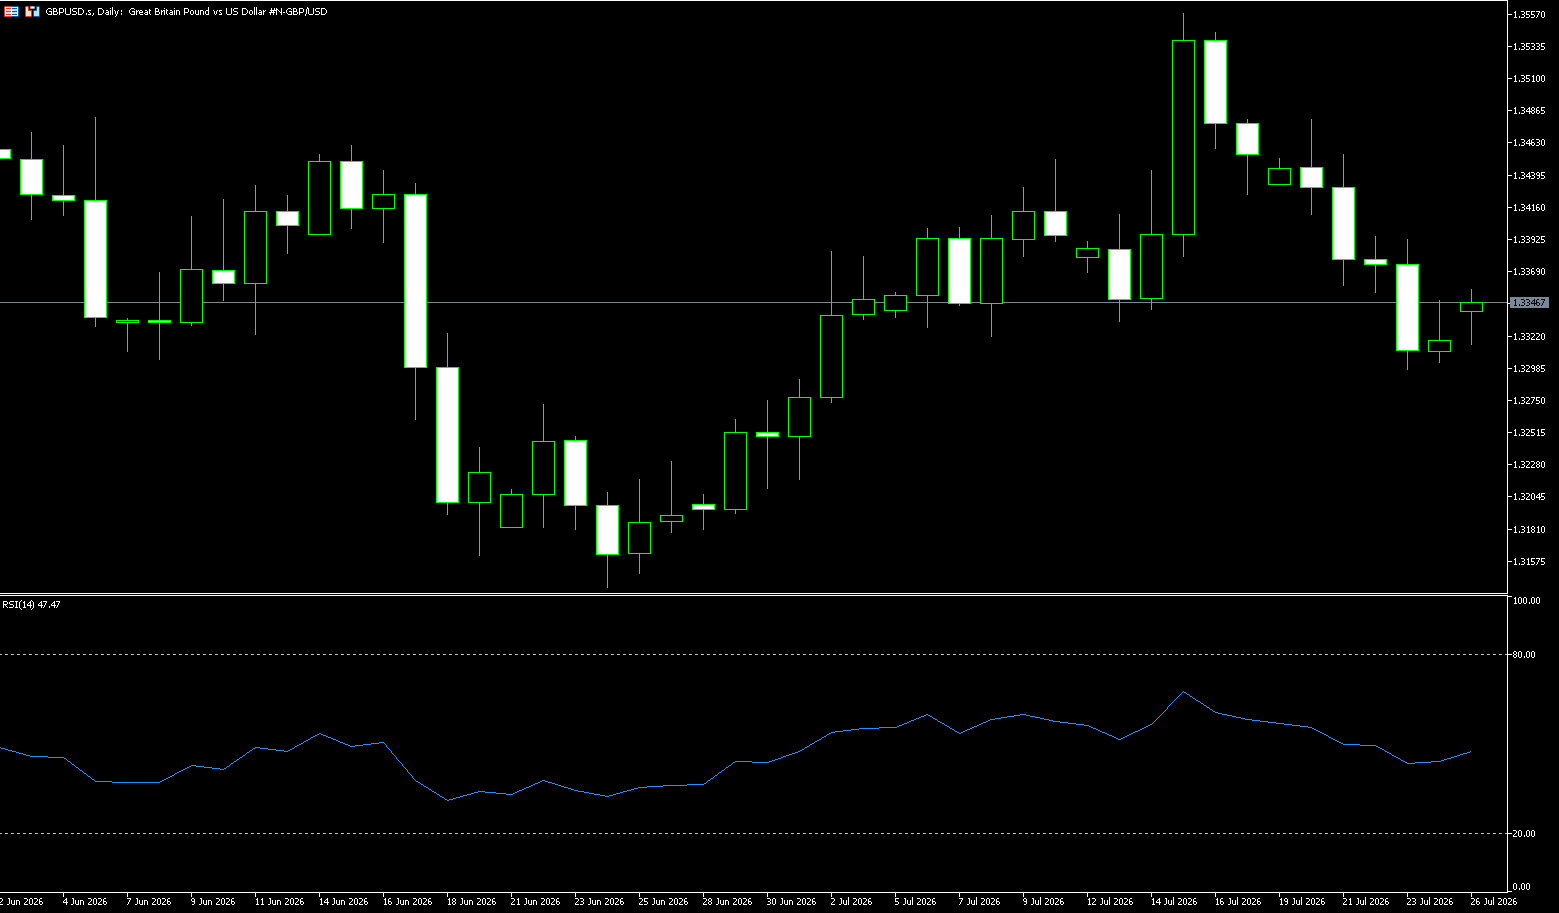
The pound fell below a near three-week low of 1.3300 against the dollar before the weekend, as investors digested new fiscal announcements and a more hawkish interest rate outlook. Chancellor of the Exchequer John Healy warned of rising business costs and persistent cost-of-living pressures, exacerbating concerns about the UK's inflation outlook. Earlier in the day, Prime Minister Andy Burnham announced a 20% tax cut for businesses, clubs, and live music venues from April, the third such measure announced in three days to support businesses and households. He also reiterated his commitment to maintaining fiscal discipline. Meanwhile, escalating tensions in the Middle East pushed oil prices to near two-month highs, increasing inflation risks. Consequently, currency markets now anticipate the Bank of England raising interest rates by nearly two quarter-point increments before the end of the year.
However, amid risk-averse market sentiment, UK data failed to offset the strength of the US dollar. Reports of attacks on Saudi ships in the Red Sea pushed Brent crude to near $100, exacerbating global inflation concerns and pushing US Treasury yields to multi-month highs. If that wasn't enough, the Trump administration announced new tariffs of 10% to 12% on 60 trading partners, further dampening investor sentiment as the temporary 10% global tariffs expired. On the other hand, the pound was also dragged down this week by its own weaknesses, with investors increasingly worried that Prime Minister Andrew Burnham's spending plans could jeopardize the UK's fiscal stability. The recent strength of the pound is unlikely to be sustainable; the rebound is driven more by positioning, arbitrage, and potential M&A flows than by sustained improvement in UK fundamentals.
The pound is currently in a typical "tug-of-war" pattern against the dollar. Domestically, the unexpectedly low inflation data has reduced the urgency for the Bank of England to raise interest rates, but the stickiness of core inflation means a policy shift will take time. Internationally, the escalating conflict in the Middle East, with continuous US airstrikes, Iran expanding its strike range, and Kuwait becoming involved in the conflict, has steadily increased demand for the dollar as a safe haven.
The daily chart for the pound against the dollar shows that the current price is near 1.3300 and has fallen back to support near the 5-day exponential moving average at 1.3364. The previous pullback from the upper edge of the descending triangle at 1.3540 indicates a weakening of upward momentum. The RSI indicator is currently around 44.85, in the neutral zone, indicating some recovery in buying power, but no clear breakout signal has yet formed. Meanwhile, the MACD has formed a death cross and the bearish green bars continue, indicating a shift from the previous upward trend to a downward consolidation pattern in the medium term.
The exchange rate has been falling continuously since the high of 1.3558 on July 15th, breaking below the 50-day (1.3369) and 200-day (1.3398) moving averages, with short-term moving averages forming bearish resistance. After a continuous short-term decline, there are signs of a slight bottoming out and a potential technical rebound. However, the strong resistance from the dense moving averages above suggests that the rebound is more likely to be a correction and not a direct reversal of the trend. Currently, the price is at a critical juncture: holding above the 1.3300 range; a decisive break below this level would open up further downside potential. Due to the prevailing short-term downtrend, but with oversold conditions following consecutive declines and a lack of strong bullish momentum, the initial rebound next week is expected to be limited by the 50-day moving average (1.3369) and the 200-day moving average (1.3398). A break below these levels could open up further upside potential to the July 15 high of 1.3558. Support levels to watch are the July 8 low of 1.3320 and the psychological level of 1.3300. A break below these areas could lead to a further test of the July 1 low of 1.3219.
Today, consider going long on GBP at 1.3310, with a stop-loss at 1.3300 and targets at 1.3360 and 1.3370.
USD/JPY
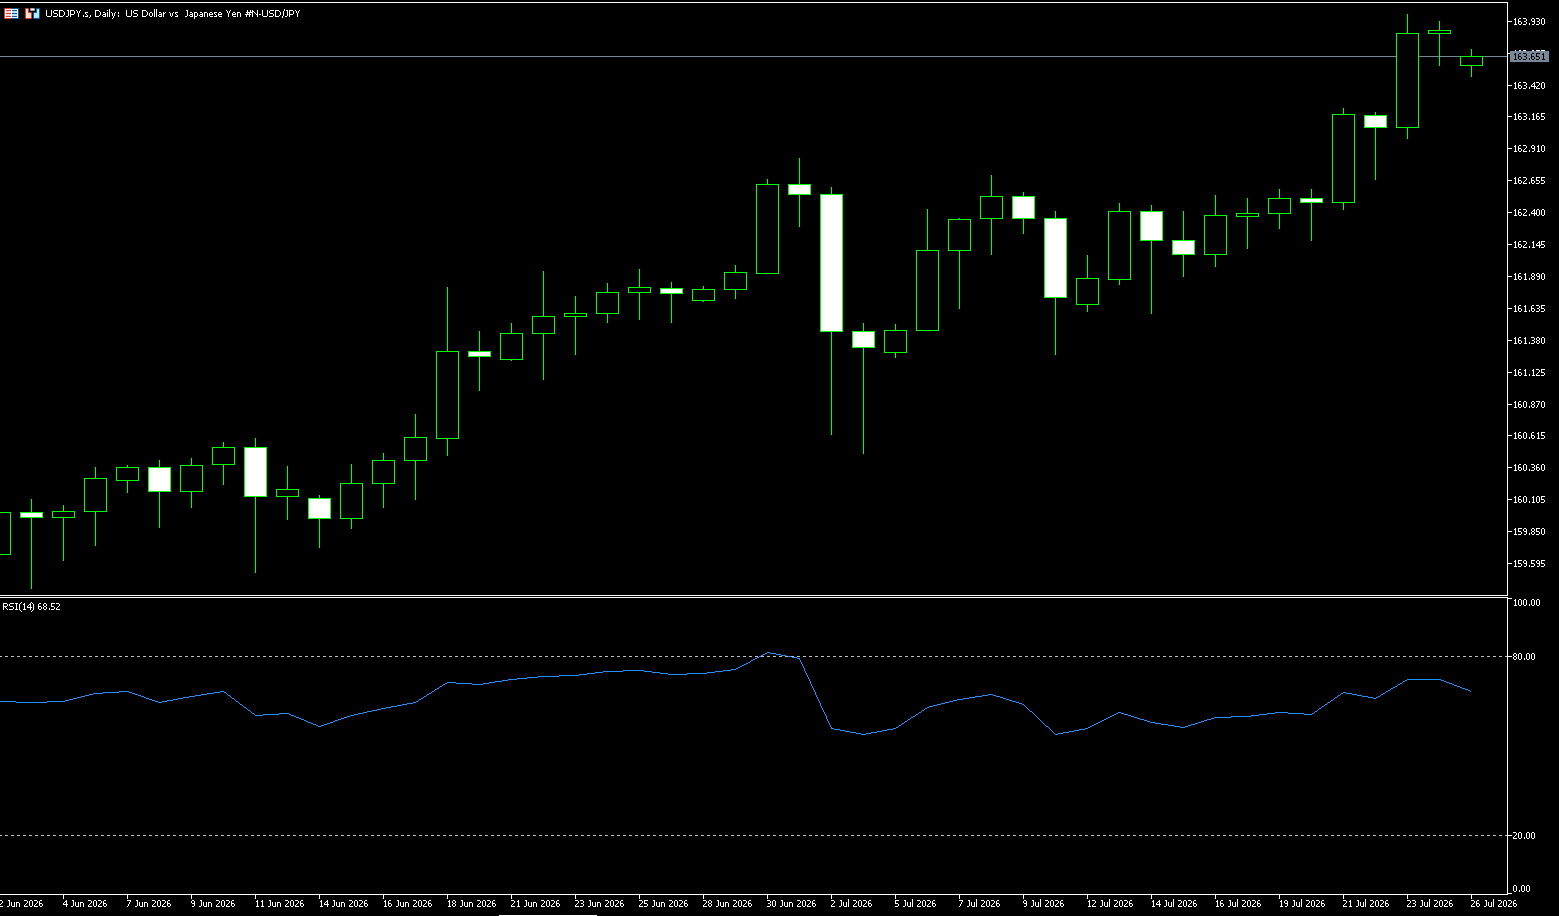
The yen is hovering near forty-year lows, at around 164.00 per dollar, despite repeated warnings of possible intervention failing to curb its weakness due to a generally strong dollar. Traders largely dismissed comments from Japan's finance minister, who stated the government was prepared to take decisive action in the foreign exchange market (if necessary), and reports that Bank of Japan officials were open to a faster pace of interest rate hikes than currently expected by the market. Concerns about Prime Minister Sanae Takaichi's fiscal policy also weighed on the currency, while escalating US-Iran tensions raised concerns about the Japanese economy, given Japan's heavy reliance on imported energy. The yen has fallen 0.8% so far this week and is on track for its worst weekly performance since May, when it weakened following record Japanese currency intervention.
The yen is currently mired in a historically weak position, with its exchange rate continuously hitting multi-year lows, making it a core focus of the global foreign exchange market. Recently, the USD/JPY exchange rate touched 164.00, a 40-year low since December 1986. The yen has not only depreciated sharply against the dollar but has also weakened against the euro, the pound sterling, and most Asian currencies, fully demonstrating the global nature of this round of yen depreciation. Despite the Bank of Japan initiating its interest rate hike cycle, Japanese interest rates remain at an absolute low compared to market expectations of a Federal Reserve rate hike this year, continuously attracting funds to the US dollar and selling the yen. Meanwhile, escalating geopolitical conflicts in the Middle East, with the US-Iran confrontation exacerbating regional instability, have boosted global risk aversion, further pressuring the yen. In addition, high international oil prices, coupled with uncertainty surrounding Japan's fiscal outlook, continue to weigh on the yen's performance.
The USD/JPY exchange rate continues to move along its medium-term upward channel, reaching a 40-year high of 164.00 this week. All short-term moving averages on the weekly chart are in a bullish alignment, indicating a intact medium-term uptrend. On the daily chart, the exchange rate has stabilized above the 9-day (162.85) and 14-day (162.63) simple moving averages, maintaining a complete upward channel. Short-term characteristics: approaching historical highs, the battle between bulls and bears is intensifying, and a rapid pullback could occur at any time; expectations of intervention continue to suppress further upside potential. Technical Indicators: The weekly RSI is approaching 69.20, entering a strong zone, with room to move before reaching the 70 overbought level, but the risk of high-level consolidation is increasing; the weekly MACD histogram continues to rise, but bullish momentum is showing signs of slowing.
From a technical perspective, after successfully stabilizing above the 163.40 level, the USD/JPY pair has a clear short-term upward trend. If the exchange rate continues to rise and breaks through 164, it will reach the upper edge of the core intervention range calculated by Nomura Securities; conversely, if the exchange rate falls below 163, it means that the warning signals from the Japanese government are beginning to take effect, and new dollar buying in the market will be suppressed. Short-term exchange rate forecast: After breaking through 164, the risk of intervention increases significantly. It is expected that the USD/JPY exchange rate will fluctuate above the 162.40 support level this week, repeatedly testing the 164 level; if it cannot effectively stabilize above 164.00 (the psychological level), it will enter a period of high-level consolidation to digest bullish momentum. If it holds above 164, the target is 164.50, with a further test of the upper channel line at 165.00. On the downside, a pullback is expected after a rally, with targets at 162.84 (the high at the beginning of the month) and the psychological level of 162.00.
Today, consider shorting the US dollar at 164.00, with a stop loss at 164.20 and targets at 163.24 and 163.10.
EUR/USD
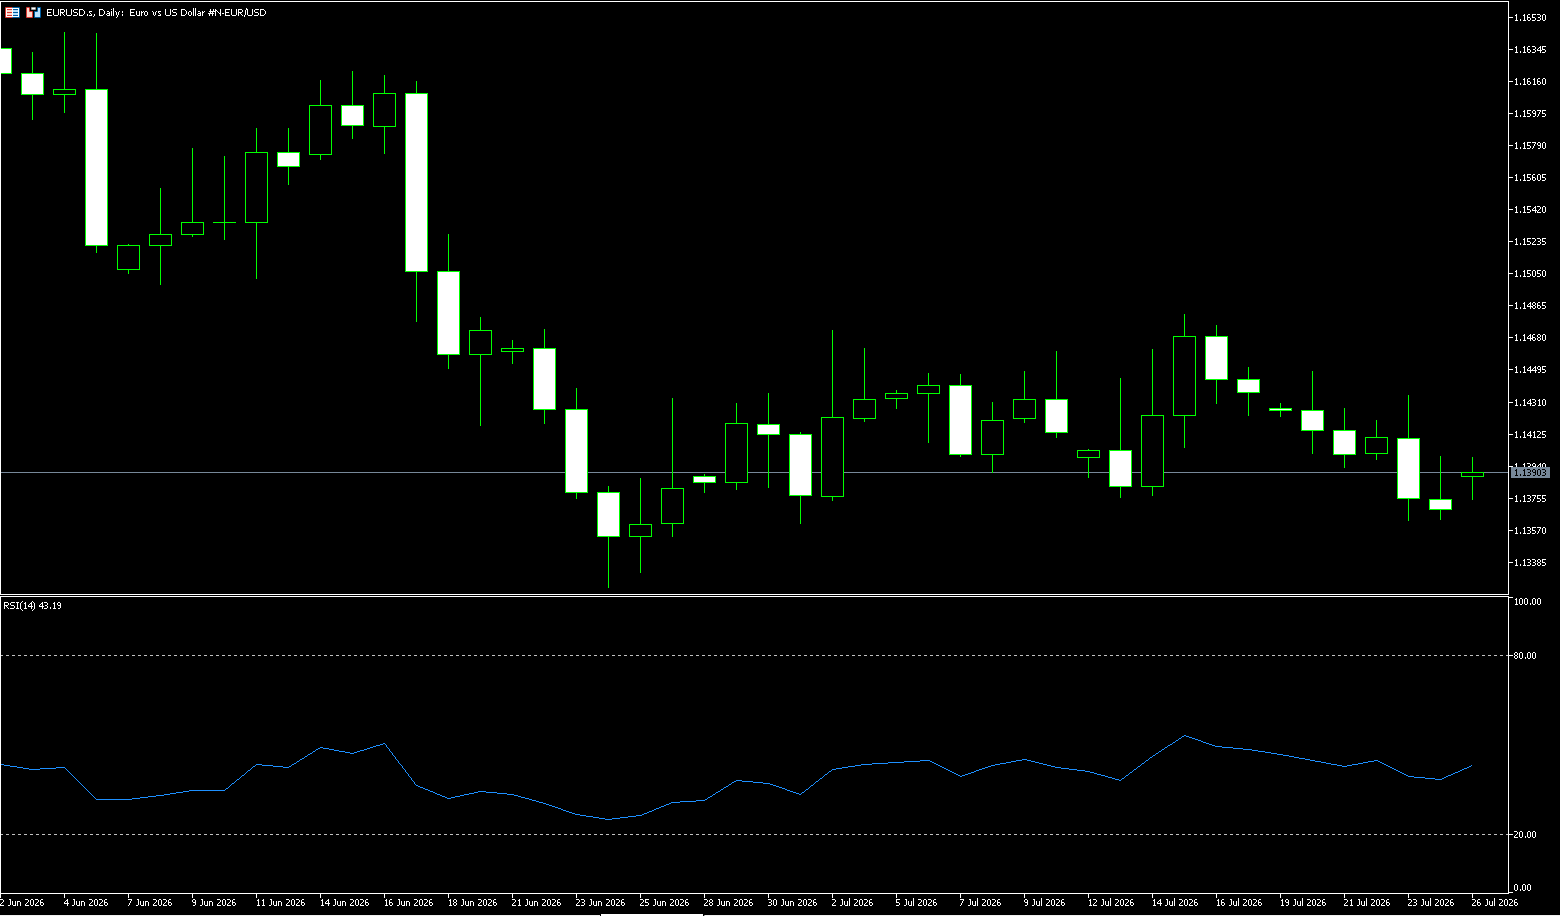
Last week, the European Central Bank kept its main refinancing rate unchanged at 2.40% and its marginal lending rate unchanged at 2.65%, in line with market expectations. Following the announcement, the euro briefly touched slightly below 1.1400 against the dollar, with a relatively mild overall market reaction. The global market remains in an environment of fluctuating energy prices and geopolitical uncertainties. While the return of oil prices to high levels is putting pressure on inflation, slowing wage growth and weak economic data in the Eurozone provide central banks with room for observation. This decision did not provide pre-committed path guidance, emphasizing that decisions will be made based on inflation outlook and risk assessment.
Considering the current market situation, the Eurozone interest rate path will continue to be dominated by energy dynamics. If the energy shock persists and a second round of effects gradually emerges, pressure for monetary policy tightening may reappear in subsequent meetings; conversely, if wage and price data remain moderate, the observation period may be extended. Regarding exchange rates, the euro/dollar exchange rate may fluctuate around current levels, awaiting further data confirmation. European stock indices lack clear directional drivers in the short term, and attention should be paid to the balanced statements from Lagarde's press conference to further calibrate market expectations. Overall trend extrapolation depends on the evolution of geopolitical and energy factors and the confirmation of economic data; both short- and long-term logic point to cautious data-driven rather than predetermined paths.
Last week, the euro/dollar exchange rate failed near the 1.1480-1.1485 area (the mid-July high) and has continued to show a bearish pattern, coinciding with the 45-day simple moving average (1.1486). Furthermore, the MACD indicator (above the zero line, the red bars are shrinking, indicating weakening bullish momentum; continued shrinking bars could trigger a daily-level pullback) shows a converging and diverging trend. The 14-day Relative Strength Index (RSI) is around 39, not overbought, and there are no conditions for a trend reversal; it remains below the midline. The daily chart shows that the Euro/USD pair is in a bullish consolidation phase, with the short-term upward channel intact, but multiple attempts to break through the 1.1480-1.1485 area have met resistance, suggesting a potential pullback to confirm support. The price has stabilized above 1.1324 (the low of June 24th), maintaining the bullish structure; however, multiple bearish divergences on the 4-hour chart suggest a risk of a short-term pullback.
The EUR/USD pair has been consistently capped below its 34-day simple moving average (currently at 1.3444) since mid-May. This, in turn, supports the possibility of a break below 1.1324 (the low of June 24th) and the psychological level of 1.1300. The EUR/USD bullish momentum is expected to be weak, with the market awaiting guidance from the Fed's decision. A hawkish Fed stance and strong economic data have fueled a continued dollar rebound, but a sustained one-sided upward trend is lacking. Next week's price action will likely see repeated tests of the 1.1324 resistance level, followed by pullbacks and support around 1.1300. Conversely, if the Fed releases dovish comments next week and US employment/PMI data weakens, the dollar index will decline. The pair could then retest the 1.1482 (the high of July 15th) and the 1.1500 psychological level.
Today, consider going long on the Euro at 1.1356, with a stop-loss at 1.1345 and targets at 1.1410 and 1.1420.
Stock Analysis:
Australian ASX 200 Stock Index
Basic Market Overview:
The Australian ASX 200 index fell 67 points, or 0.75%, to close at 8,772 on Friday, reversing gains from the previous three trading days. Weakness spread across the technology, consumer durables, non-energy mining, and healthcare sectors. Market sentiment worsened after the Trump administration announced new tariffs on 60 trading partners. The index fell 0.3% this week, marking its third consecutive weekly decline, as strong June employment data reinforced market expectations for further tightening of policy by the Reserve Bank after three rate hikes this year.
Next week's June and second-quarter inflation data are under close scrutiny amid ongoing price concerns. Technology leaders Xero (-4.5%), Wisetech Global (-4.6%), and Megaport (-3.3%) led the decline, while gold miners Northern Star (-3.9%) and Evolution (-2.4%) also fell. In contrast, the four major banks saw gains between 1.0% and 1.5%. Energy stocks also rose, as oil prices broke through $100 after US President Trump warned of "significant military retaliation" against Iran.
Sector Performance:
Last Week's Top Performing Sectors (Ranked by Weekly Gains/Losses)
1. Energy (XEJ) +5.90% [Strongest Sector This Week]
Driven by: Middle East geopolitical conflicts pushing up international crude oil prices; improved profit expectations for oil and gas companies.
Representative Stocks: Woodside Energy, Santos, Karoon Energy, Yancoal
2. Materials (XMJ) +1.70%
Driven by: Gold prices fluctuating at high levels, copper prices stabilizing; uranium and gold mines performing strongly; iron ore maintaining range-bound trading.
Representative Stocks: BHP, Rio Tinto, South32, Paladin Energy (PDN), Northern Star Resources
3. Utilities (XUJ) Slightly Up
Driven by: Defensive funds seeking safe haven; high-dividend stocks favored by investors.
Lagging Sectors (Ranked by Decline from Largest to Smallest)
4. Information Technology (IT) -3.32% [Weakest Sector in the Market] Negative Factors: Rising interest rate hike expectations suppress growth valuations; US tech stocks weakened overnight.
Representative Stocks: WiseTech Global (WTC -6.97%), Xero (XRO -5.01%), Life360 (-5.45%)
5. Consumer Discretionary -1.52%
Representative: Wesfarmers (WES) showed significant weakness.
6. Healthcare -1.43%
7. Telecommunications -1.15%
8. Industrials -0.46%
9. Consumer Staples - Slightly lower.
Technical Analysis:
The Australian Q2 CPI inflation data on July 29th is the biggest fundamental catalyst this week; simultaneously, the Fed's interest rate meeting and earnings reports from US tech giants will be released. Overnight volatility in US stocks will directly affect the ASX opening. Thursday's focus is on the Federal Reserve's interest rate decision and Powell's speech; if the Fed releases hawkish signals, global risk appetite will decline, and the ASX will follow suit. Volatility in US tech earnings reports will directly impact the Australian tech sector. The index is currently in a high-level range-bound pattern; the medium-term upward trend remains intact, but short-term upward momentum is weakening. Last week, it repeatedly attempted to break above 8820 but failed to hold, closing lower on Friday; the RSI has fallen to the 52 neutral zone, not yet entering overbought/oversold territory; the MACD histogram continues to narrow, indicating weakening bullish momentum and a need for a pullback to confirm support. The index will initially face slight pressure, testing the 8700 support; if this support holds, it will likely rebound to challenge the 8830 resistance level; a decisive break above 8860 is needed to open up space for an upward test of 8900. Higher-than-expected CPI fueled expectations of an RBA rate hike, coupled with a US stock market correction, causing the index to fall below 8700, with a downside target of 8620. If 8620 is breached, the consolidation pattern weakens, with a further target of 8550. Inflation significantly lower than expected fueled expectations of a rate cut, causing the index to break through 8860 and challenge resistance near 8900.
Trading Strategy:
The following is for technical trading purposes only and does not constitute investment advice. Leveraged trading may result in losses exceeding the principal.
This Week's Trading Strategy (Index Trading, Primarily Short-Term):
Premise: In a volatile market, avoid chasing one-sided trends and wait for key levels to act.
Bull Strategy:
• Pullback Opportunities: Consider a small long position if the price retraces to around 8700 and stabilizes with a positive close; set a stop-loss below 8670.
• First Target: 8830; add to the position if it breaks through 8860, targeting 8900; if 8830 is repeatedly tested and fails to break through, take profits and exit the long position.
Chasing rallies below the 8830 resistance level is strictly prohibited.
Bearish Strategy
• Rebound Opportunity: If the price rebounds to the 8820-8850 range and encounters resistance, a small short position can be initiated; stop loss above 8880.
• First Downside Target: 8700; if it breaks below 8700, hold the position and target 8620.
• Observation Conditions (No Positions): The market opened on Monday and continued to fluctuate narrowly between 8730 and 8800. Reduce positions before Wednesday's CPI data release to avoid the risk of a data gap.
• Position Management: Low positions are recommended in volatile markets; reduce positions by more than 50% in advance during the CPI and Fed rate decision periods to guard against gaps.
Key Risk Warnings:
1. Domestic Core Risks [Highest Priority]
July 29th Australian Q2 CPI Inflation Data:
• Inflation significantly higher than expected → Market pricing in another RBA rate hike, putting pressure on banks and growth stocks, and causing the index to decline;
• Inflation significantly lower → Increased expectations of rate cuts, which is beneficial to the stock market. Inflation data is highly likely to trigger a significant gap in price action.
2. External Macroeconomic Risks
Thursday's Fed interest rate decision and Powell's speech; if the Fed releases a hawkish signal, global risk appetite will decline, and the ASX will follow the external downward trend. Fluctuations in US tech earnings reports will directly affect the Australian tech sector.
3. Commodity Risks
Iron ore price fluctuations directly affect heavyweight mining stocks such as BHP and RIO; Australian dollar exchange rate fluctuations differentiate between resource stocks and domestic demand sectors; significant fluctuations in international oil prices impact the energy sector.
4. Technical Breakdown Risk
A decisive break below 8620 would destroy the short-term upward trend and usher in a period of consolidation. Avoid counter-trend bottom-fishing.
A sustained hold above 8860 would indicate an upward breakout from the consolidation pattern, requiring a shift in strategy and abandoning short-term short positions.
5. Trading Risk Warning
ASX200 index-related futures and CFDs involve high leverage, with extremely high overnight gap risks. Overseas events and data can easily create significant gaps; strictly adhere to stop-loss orders and avoid holding losing positions.
Dow Jones Industrial Average
Basic Market Overview:
The three major US stock indices diverged last week. Investors simultaneously assessed the latest developments in the Middle East situation and potential US-Iran negotiations, while digesting technology company earnings reports. A concentrated sell-off in chip stocks dragged down the Nasdaq, while a surge of approximately 3% in Apple shares pushed the Dow Jones Industrial Average up by over 200 points. At the close, the S&P 500 rose slightly by 0.05% to 7411.98 points; the Nasdaq Composite fell 0.64% to 24975.82 points; and the Dow Jones Industrial Average rose 235.60 points, or 0.46%, to 51947.25 points. For the week, all major U.S. stock indices declined. The S&P 500 fell 0.6%, the Nasdaq fell 2.1%, both marking their second consecutive week of declines; and the Dow fell 0.4%, its third consecutive week of losses. U.S. stocks initially rose in early trading, while international oil prices retreated in tandem. Reuters, citing three Pakistani sources, reported that Pakistan, under Chinese pressure, is considering ways to initiate a new round of peace talks between the U.S. and Iran. However, the sources also indicated that significant obstacles remain for resuming dialogue between the two sides.
Market hopes for diplomatic mediation briefly eased investor concerns about energy supply disruptions, but gains narrowed significantly as reports emerged of a potential escalation of U.S. military action against Iran.
Sector Performance:
Leading Sectors
Expected Leading Sectors + Core Dow Jones Components
Healthcare (Defensive Choice)
Logic: Rising market risk aversion; high dividends, stable cash flow, hedging against interest rate uncertainty.
Representative Stocks: Johnson & Johnson (JNJ), UnitedHealth Group (UNH)
Industrials/Capital Goods (Cyclical Value)
Logic: Resilient infrastructure and energy capital expenditures; geopolitical premium; relatively reasonable valuations.
Representative Stocks: Caterpillar (CAT), 3M (MMM), Raytheon Technologies (RTX)
Large Banks (Financial Sector)
Logic: Resilient net interest margins; valuation recovery if the Fed releases dovish signals.
Representative Stocks: JPMorgan Chase (JPM), Goldman Sachs (GS) (one of the Dow Jones' highest-weighted components)
Expected Lagging Sectors + Core Dow Jones Components
Largest Software/AI Technology (Highest Risk Sector)
Logic: Recent Google earnings report raises market concerns about excessive AI capital expenditures; Microsoft and Apple earnings reports next week, with slightly weaker-than-expected guidance easily triggering sell-offs.
Representative Stocks: Microsoft (MSFT), IBM, Salesforce CRM
Optional Consumption
Logic: Sticky inflation + persistently high interest rates suppress consumer expectations
Representative Stocks: Nike NKE, Home Depot HD
Energy (Weak and Volatile)
Logic: Oil prices have fallen from their highs, and the premium from the Middle East conflict has subsided; downward pressure on demand expectations will likely lead to further declines.
Representative Stocks: Chevron CVX
Technical Analysis:
Next week is packed with super catalysts – the Fed's FOMC interest rate decision, US Q2 GDP, core PCE inflation data, and numerous earnings reports from leading companies. News events could easily disrupt technical patterns; heavy betting based solely on technical levels is strictly prohibited. Weekly Chart (Medium-Term Structure): The Dow Jones Industrial Average has been consolidating and correcting since its year-to-date high of 53,289. The weekly chart shows two consecutive weeks of downward movement, forming a lower high structure. The price remains above the 50-week moving average, indicating that the medium-to-long-term bullish trend is not yet broken, but upward momentum is clearly weakening. Technical indicators show the weekly RSI has fallen back to the neutral range, not yet oversold, and still has room for further adjustment; the MACD red bars continue to shrink, with a risk of forming a death cross. Strong weekly resistance: 52,700-52,900; Key weekly support: 50,800 (medium-term strength/weakness dividing line); Reduce positions before the Fed decision, avoid heavy positions betting on direction; wait for a valid price breakout/breakdown of the range before following the trend. As for the daily chart, it has entered a range-bound consolidation pattern, with a range of 51,500 (lower limit) - 52,350 (upper limit); Regarding moving averages: the price is trading below the 20-day moving average, indicating short-term weakness; the 50-day moving average provides support around 51,500. Oscillators: the daily RSI is fluctuating between 45 and 52, without a clear one-sided signal, suggesting that next week will likely see range-bound trading, awaiting the Fed decision to choose a direction.
Trading Strategy:
The information provided is for market analysis purposes only and does not constitute any trading or investment advice.
Next Week's Practical Trading Strategy (Short-Term 3-5 Day Perspective)
Principles: Reduce positions before the Fed decision; avoid heavy positions betting on direction; wait for a valid price breakout/breakdown of the trading range before following the trend.
1) Trading Range Strategy (Monday and Tuesday, prioritize execution before the interest rate decision)
Short-Term Long (Buy on Dips)
• Entry: A bottoming candlestick pattern appears in the 51550-51700 range.
• Stop Loss: Below 51420
• Target: 52100 → 52300, take profit in batches.
Short-Term Short (Sell on Rebounds)
• Entry: A pullback occurs when the price encounters resistance in the 52150-52300 range.
• Stop Loss: Above 52400
• Target: 51700 → 51500
2) Breakout Trend-Following Strategy (Wednesday evening after the interest rate decision, await direction selection)
Bullish Breakout Plan
Price closes above the daily chart Above 52350, buy on a pullback to around 52200.
Stop loss: 51950
Target 1: 52700, Target 2: 52900
Breakdown Plan: If the price breaks below 51450 on the daily chart, sell on a rebound to around 51500.
Stop loss: 51850
First target: 50800; if 50800 is breached, continue to target 50200.
Key Risks Next Week:
1. Fed Policy Risk (Biggest Variable): Expectations are for interest rates to remain unchanged; focus on the Chairman's remarks regarding the September rate hike; hawkish statements are bearish for Dow Jones and value stocks; dovish statements are bullish.
2. US core PCE inflation and Q2 GDP data;
3. Earnings reports from major companies (Apple, Microsoft, Amazon, Meta) influence market risk appetite;
4. Fluctuations in US Treasury yields, with many interest rate-sensitive blue-chip stocks in the Dow Jones Industrial Average (financials, industrials, utilities) being heavily impacted by yield fluctuations.
Disclaimer: The information contained herein (1) is proprietary to BCR and/or its content providers; (2) may not be copied or distributed; (3) is not warranted to be accurate, complete or timely; and, (4) does not constitute advice or a recommendation by BCR or its content providers in respect of the investment in financial instruments. Neither BCR or its content providers are responsible for any damages or losses arising from any use of this information. Past performance is no guarantee of future results.
More Coverage



Risk Disclosure:Derivatives are traded over-the-counter on margin, which means they carry a high level of risk and there is a possibility you could lose all of your investment. These products are not suitable for all investors. Please ensure you fully understand the risks and carefully consider your financial situation and trading experience before trading. Seek independent financial advice if necessary before opening an account with BCR.
BCR Co Pty Ltd (Company No. 1975046) is a company incorporated under the laws of the British Virgin Islands, with its registered office at Trident Chambers, Wickham’s Cay 1, Road Town, Tortola, British Virgin Islands, and is licensed and regulated by the British Virgin Islands Financial Services Commission under License No. SIBA/L/19/1122.
Open Bridge Limited (Company No. 16701394) is a company incorporated under the Companies Act 2006 and registered in England and Wales, with its registered address at Kemp House, 160 City Road, London, England, EC1V 2NX. Open Bridge Limited acts solely as a payment processor for BCR Co Pty Ltd and does not provide any financial, trading, or investment services on its behalf. Open Bridge Limited's role is limited to payment processing.


 English
 简体中文
简体中文
 繁體中文
繁體中文
 Bahasa
Melayu
Bahasa
Melayu
 Tiếng
Việt
Tiếng
Việt
 ไทย
ไทย
 日本語
日本語
 한국어
한국어
 ភាសាខ្មែរ
 español